Understood. As an expert in quantitative finance and technical documentation, I will now provide a professional and accurate translation of the provided Chinese Markdown content into English, adhering strictly to the specified guidelines.
TRUMPUSDT Quantitative Analysis Report (Based on Wyckoff Methodology)
Product Code: TRUMPUSDT
Analysis Date Range: 2026-02-11 to 2026-04-12
Report Generation Date: 2026-04-13
Core Objective: To identify market phases, supply-demand dynamics, and large investor behavior based on price-volume data and Wyckoff principles, and to derive actionable trading signals.
Dimension One: Trend Analysis and Market Phase Identification
As of 2026-04-12, the subject TRUMPUSDT has an open price of 2.83, a close price of 2.81, a 5-day moving average of 2.91, a 10-day MA of 2.88, a 20-day MA of 2.97, a daily change of -0.50%, a weekly change of -2.22%, a monthly change of -6.64%, a quarterly change of -6.64%, and a yearly change of -41.39%.

1. Moving Average Alignment and Price Structure:
- • Long-term Trend (Bear Market): As of 2026-04-12, the price (2.814) is below all major moving averages (MA_5D: 2.905, MA_10D: 2.876, MA_20D: 2.972, MA_30D: 3.185, MA_60D: 3.247), forming a standard bearish alignment. MA_60D has declined consistently from 4.86 on February 11th to 3.247 on April 12th, confirming a long-term downtrend.
- • Key Moving Average Crossover: Around March 16th, MA_5D (3.55) crossed below MA_20D (3.34), forming a clear "death cross" signal, marking the end of the rebound that began around March 13th and the reassertion of bearish control.
- • Price Action: The market experienced two main phases during the analysis period:
- • Phase One (Feb 11 - Mar 7): Prolonged, gradual decline. The price oscillated downward from 3.22 to 3.003. Although there were rebounds (e.g., rising to 3.572 on Feb 20th), subsequent highs were lower (LH) and lows also descended (LL), forming a classic downtrend structure.
- • Phase Two (Mar 12 - Apr 12): Weak consolidation following panic selling. Extreme volatility occurred on Mar 12-13 (panic selling and rebound). After entering the 3.9-4.15 range, the price quickly reversed downward (Mar 16-20), constituting a failed rally. The current price has retreated near the previous lows.
2. Wyckoff Market Phase Inference:
- • 2026-03-12 to 2026-03-15: This phase aligns with the characteristics of "Panic Selling" and "Automatic Rally." On March 12th, the price dipped to 2.705 (the 2nd lowest
WEEK_MIN_LOWin nearly a decade) accompanied by massive volume (620% volume growth, historically ranked 2nd inWEEK_MAX_VOLUME_GROWTH), a classic signal of panic selling. A sharp rebound followed on March 13th-14th, with record-breaking volume (historically ranked 11th inWEEK_MAX_VOLUME), constituting the automatic rally. - • 2026-03-15 to 2026-03-18: The rally met resistance and retreated within the 4.0-4.5 range, accompanied by high volume (
VOLUME_AVG_7D_RATIOat historically elevated levels). This aligns with the "Distribution" phase, where large investors likely distributed holdings to retail traders chasing the rally. - • 2026-03-19 to Present: The price has rapidly declined from the distribution range and is now approaching the previous panic low. Volume has significantly contracted (April 12th
VOLUME_AVG_14D_RATIOis 1.10, near normal levels) and price movement is narrow. The current state may be a "Secondary Test" in the late stages of a downtrend or the beginning of a new downswing, requiring further judgment based on supply-demand dynamics.
Dimension Two: Price-Volume Relationship and Supply-Demand Dynamics
As of 2026-04-12, the subject TRUMPUSDT has an open price of 2.83, a close price of 2.81, a volume of 2932336.40, a daily change of -0.50%, a volume of 2932336.40, a 7-day average volume of 2992864.60, and a 7-day volume ratio of 0.98.

1. Key Price-Volume Event Analysis:
- • Panic Selling and Demand Absorption (2026-03-12/13): On March 12th, extremely high volume (VOLUME 10.42 million,
VOLUME_AVG_14D_RATIOat 4.14) accompanied a positive close (PCT_CHANGE 1.24%), indicating capital absorbing panic selling around the 2.705 zone. March 13th saw record volume (42.66 million, historically ranked 11th) with a 31.55% price increase, a clear signal of overwhelming demand entry. However, historical rankings show itsWEEK_MAX_VOLUME_AVG_14D_RATIOreached 13.77, ranking first historically. Such extreme volume often signals a major turning point or distribution event. - • Distribution Confirmation (2026-03-14/15): The price continued to rise but with diminishing gains (3.91% -> 0.90%), while volume remained high but contracted from the previous day. This is "high-volume stalling," indicating the emergence of supply and an inability of demand to push prices higher. In Wyckoff theory, this is a sign of an "Upthrust" or distribution.
- • Supply-Dominated Decline (2026-03-17/18/19): The price declined for three consecutive days (-6.27%, -4.75%, -3.93%) with volume receding but still above long-term averages (
VOLUME_AVG_60D_RATIOaround 1.7). This demonstrates continued supply pressure. - • Demand Exhaustion and Consolidation (2026-04-12): The price declined slightly (-0.50%) with volume near the 14-day average (
VOLUME_AVG_14D_RATIO1.10). This low-volume, narrow-range movement indicates low activity from both buyers and sellers at current levels, with the market awaiting a new directional catalyst.
2. Supply-Demand Power Shift:
- • The data suggests that major supply was released during the March 15-18 distribution range and subsequently suppressed prices during the decline.
- • Major demand surged during the March 12-13 panic selling but failed to sustain prices above the distribution range, indicating subsequent demand weakness.
- • Currently (April 12th), contracted volume to normal levels suggests temporary easing of supply pressure, but also no sign of new significant demand entry. The market is in a delicate supply-demand balance. However, given the overall downtrend, this balance is more likely to be broken by renewed supply.
Dimension Three: Volatility and Market Sentiment
As of 2026-04-12, the subject TRUMPUSDT has an open price of 2.83, a 7-day intraday volatility of 0.53, a 7-day intraday volatility ratio of 0.93, a 7-day historical volatility of 0.52, a 7-day historical volatility ratio of 0.99, and an RSI of 38.99.

1. Volatility Extremes:
- • In mid-March 2026, volatility metrics reached historical highs.
HIS_VOLA_7Dreached 2.092 on March 13th, and its ratios to 14, 21, 30, and 60-day volatility (HIS_VOLA_RATIO_*) all entered the historical top 20 rankings, withWEEK_MAX_HIS_VOLA_RATIO_7D_14Dranking 5th. Parkinson volatility ratios showed similar patterns (WEEK_MAX_PARKINSON_RATIO_7D_60Dranked 8th). This extremely abnormal volatility expansion is quantitative evidence of market panic and trend acceleration. - • By April 12th, volatility has significantly converged.
HIS_VOLA_7Dis 0.519,PARKINSON_VOL_7Dis 0.530, both falling back to normal-low levels. Short-to-long-term volatility ratios (e.g.,HIS_VOLA_RATIO_7D_14Dat 0.989) also approach 1, indicating a shift in market sentiment from extreme panic to apathy and uncertainty.
2. Overbought/Oversold Validation:
- • RSI_14 reached 18.17 on February 11th, the second lowest value in nearly a decade (
WEEK_MIN_RSI_14ranked 2nd), confirming an oversold condition that triggered the subsequent rebound. - • On March 15th, RSI_14 peaked at 67.31 (
WEEK_MAX_RSI_14ranked 10th), confirming an overbought condition at the rebound top, consistent with the distribution phase assessment. - • Currently (April 12th), RSI_14 is 38.99, in a weak zone but not extremely oversold. This suggests either that downward momentum is not yet fully exhausted or that sentiment is weak but stable.
Dimension Four: Relative Strength and Momentum Performance
- • Momentum Universally Weak: Returns across all timeframes are negative, and the deterioration rate of short-term momentum exceeds that of long-term.
WTD_RETURNis -2.22%,MTD_RETURNis -6.64%,QTD_RETURNis -6.64%,YTDis -41.39%. This indicates not only long-term weakness but also persistent short-term downward momentum. - • Failed Nature of the Rebound: Despite the strong rebound in mid-March (
WEEK_MAX_PCT_CHANGE31.55% ranked 3rd historically), it failed to reverse any medium or long-term (MTD, QTD, YTD) negative return patterns. This confirms the rebound was a technical correction rather than a trend reversal, validating the "post-distribution decline" assessment.
Dimension Five: Large Investor (Smart Money) Behavior Identification
Based on the above price-volume and volatility analysis, the behavioral path of large investors can be inferred:
- 1. Accumulation During Panic and Rapid Markup (Mar 12-14): During public panic selling to extreme lows (2.705), smart money conducted large-scale absorption (extreme volume) and rapidly marked up prices away from their cost base, likely to create volatility and attract attention.
- 2. Distribution at Rebound Highs (Mar 15-18): When prices rebounded above 4.0 and market sentiment turned optimistic, smart money reversed operations, distributing holdings accumulated at lows to retail traders chasing the rally. High-volume stalling and record-breaking volume ratios (historical ranking #1) are core evidence of distribution. They successfully utilized this panic-induced rebound to execute a short, sharp, and profitable inventory exchange.
- 3. Post-Distribution Withdrawal and Observation (Late March - Present): After distribution, selling pressure from smart money eased, but no strong buying intent has emerged. The market entered a phase of gradual decline and consolidation dominated by existing capital. The low-volume consolidation on April 12th reflects the dormancy of large capital activity, as they await a better opportunity (e.g., a secondary test of panic lows) or a new catalytic event.
Dimension Six: Support/Resistance Level Analysis and Trading Signals

Key Level Identification:
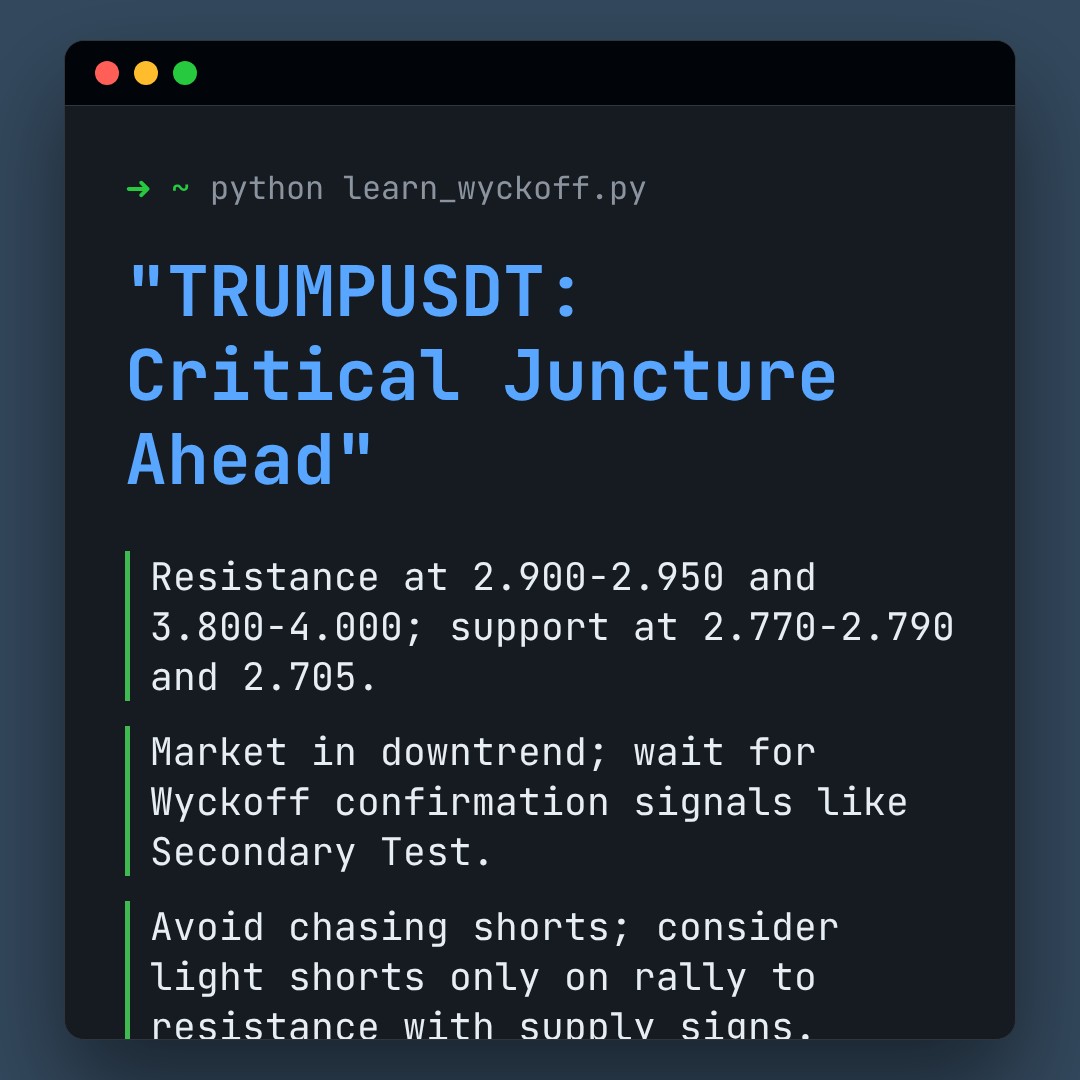
- • Primary Resistance Zone: 3.800 - 4.000. This is the high-density area formed after the March rebound, also coinciding with the current MA_30D and MA_60D, forming strong resistance.
- • Immediate Resistance Zone: 2.900 - 2.950. This is the upper boundary of the recent consolidation range and the suppression zone of MA_5D and MA_10D.
- • Key Support Zone: 2.770 - 2.790. This is the April 12th low and the area tested multiple times in early April.
- • Ultimate Support Level: 2.705. The low formed during the March 12th panic selling, holding significant psychological and technical importance.
Integrated Trading Signals and Operational Recommendations:
- 1. Market State Assessment: The market is within a long-term downtrend, having recently completed a full "panic-rally-distribution" cycle led by large investors. It is currently in the post-distribution decline phase, testing immediate support, with both supply and demand showing weakness.
- 2. Core Trading Signal: Exercise caution and wait for clearer Wyckoff events. The current low-volume consolidation does not offer high-probability trading value.
- 3. Specific Operational Recommendations:
- • Bearish Strategy (Chasing Shorts is High Risk): Although the trend is down, chasing shorts is inadvisable due to proximity to support and volatility contraction. Consider a light short position if price rallies to the 2.90-2.95 resistance zone and shows signs of renewed supply (high-volume stalling or decline), with a stop-loss set above 3.00.
- • Bullish Strategy (Left-side Trading, High Risk): Not recommended at present. A genuine bullish opportunity requires confirmation of a "Secondary Test" signal. That is, if price approaches or slightly breaches support at 2.77 or tests 2.70, it must first show "contracted volume (indicating supply exhaustion)" followed by "a strong bullish candle with expanding volume (indicating aggressive demand entry)." This would be the time to consider left-side accumulation, with an initial stop-loss below 2.65.
- • Trend Reversal Confirmation Signal (Right-side Trading): Requires price to break and hold decisively above the 3.00 level with strong volume (
VOLUME_AVG_14D_RATIO> 1.5), accompanied by MA_5D crossing above MA_20D. Until then, all rallies should be treated as counter-trend moves.
Future Validation Points:
- 1. Signals to Invalidate the Bearish View: Price consolidates above the 2.77 support, followed by consecutive up days with expanding volume, breaking through and holding 2.95, with intraday volatility (
PARKINSON_VOL_7D) beginning to rise moderately. - 2. Signals to Confirm Continuation of Downtrend: Price breaks below the 2.77 support with moderate-to-high volume (
VOLUME_AVG_14D_RATIO> 1.2), proceeds to test 2.70, and RSI_14 enters the oversold zone below 30 but price rebounds weakly. - 3. Signals to Confirm Distribution Completion and Initiation of a New Downward Wave: After prolonged (e.g., 1-2 weeks) low-volume consolidation within the 2.77-2.90 range, price ultimately chooses to break down with expanding volume.
Report Summary:
Analysis based on the Wyckoff Methodology reveals that TRUMPUSDT completed a classic bear market structure of "Panic Selling - Automatic Rally - Distribution" during the analysis period. Large investors orchestrated this mid-March rebound and successfully distributed. The current market is in a post-distribution period of low-activity consolidation, lacking clear direction, but the overall technical structure remains bearish. Traders are advised to remain patient, avoid frequent trading during low-volume consolidation, and focus on waiting for Wyckoff events confirmed by volume near the key levels outlined above before formulating corresponding attack and defense strategies.
Disclaimer: This report/analysis is solely market analysis and research based on publicly available information and does not constitute any investment advice or operational guidance. The author strives for objectivity and fairness but makes no guarantees regarding accuracy or completeness. Markets involve risk; investments require caution. Any investment actions taken based on this report are at the investor's own risk.
Thank you for your attention! Wyckoff Price-Volume Market Analysis is published daily at 8:00 AM before market open. Your comments and shares are highly appreciated. Your recognition is crucial. Let's work together to see the market signals clearly.
Member discussion: