As per your instructions. The following is a deep quantitative analysis report on the provided POLUSDT data and historical rankings, written based on Wyckoff's principles of volume and price analysis.
POLUSDT Wyckoff Volume-Price Analysis Report
Product Code: POLUSDT
Analysis Date Range: February 11, 2026 to April 12, 2026
Report Generation Date: April 13, 2026
1. Trend Analysis and Market Phase Identification
As of April 12, 2026, the underlying asset POLUSDT had an opening price of 0.09, a closing price of 0.08, a 5-day moving average of 0.09, a 10-day moving average of 0.09, a 20-day moving average of 0.09, a daily change of -3.16%, a weekly change of -8.71%, a monthly change of -9.21%, a quarterly change of -9.21%, and a yearly change of -17.61%.

1.1 Moving Average Alignment and Trend Structure:
The data clearly shows that POLUSDT has been in a distinct long-term downtrend over the past two months.
- • Bearish Alignment: The current price (0.0828) is significantly below all moving averages. The MAs show a standard bearish alignment:
MA_5D (0.08784) < MA_10D (0.08965) < MA_20D (0.09156) < MA_30D (0.09332) < MA_60D (0.09846). This indicates dominant selling pressure across all timeframes, confirming the downward trend. - • Moving Average Crossover Signals: Since late February, short-term MAs have consistently traded below longer-term MAs, with no effective or sustained bullish crossovers observed. The recent spread between MA_5D and MA_20D (-0.0372) suggests continued strong short-term downward momentum.
- • Price Action: Since the high of 0.1141 on February 25th, the price has formed a series of lower highs and lower lows. Particularly from late March to early April, the decline steepened, culminating in the lowest closing price of 0.0828 within the analysis period (and nearly the lowest in the past decade as indicated by historical rankings) on April 12th.
1.2 Inferred Market Phase (Wyckoff Framework):
Based on volume-price behavior, the market may be in the final stage of a Panic/Selling Climax, potentially transitioning into a "Secondary Test" or initial Accumulation phase.
- • Distribution: Occurred in mid-to-late February. The price peaked around 0.1141, accompanied by high-volume stagnation and pullback on February 25-26 (surge in volume without new price highs), consistent with distribution characteristics.
- • Markdown: The entire month of March was a typical Markdown phase, with orderly price decline and intermittent volume spikes (e.g., March 27th), indicating continued supply dominance.
- • Panic/Selling Climax: From April 9th to 11th, the price accelerated downward accompanied by significantly increased volume (VOLUME_AVG_7D_RATIO > 1.8), a sign of panic selling. Large sell orders were absorbed by latent demand.
- • Current Assessment: On April 12th, the price made a new low (0.0828), but volume contracted significantly (VOLUME_AVG_7D_RATIO=0.717), falling below its 7, 14, 21, 30, and 60-day averages. This pattern of "new low on diminished volume" is a potential signal of Selling Exhaustion, suggesting the panic selling may have temporarily subsided, and the market may be entering a phase of seeking balance or initial accumulation.
2. Volume-Price Relationship and Supply-Demand Dynamics
As of April 12, 2026, the underlying asset POLUSDT had an opening price of 0.09, a closing price of 0.08, volume of 43481375.30, a daily change of -3.16%, volume of 43481375.30, a 7-day average volume of 60648444.06, and a 7-day volume ratio of 0.72.

2.1 Key Volume-Price Day Analysis:
- • Demand-Dominated Day (February 14): Price rose 8.86% with a volume surge (VOLUME_AVG_7D_RATIO=1.72), one of the largest single-day gains in the analysis period, indicating strong demand influx.
- • Supply Emergence Day (February 15): Following the previous day's rally, the price reversed from highs to close lower, with volume remaining elevated, suggesting emerging supply at higher levels and faltering demand.
- • Panic Selling Day (March 27): Price fell sharply by 4.32% with massive volume expansion (VOLUME_AVG_7D_RATIO=1.58), a typical supply-dominated panic day.
- • Recent Selling Climax (April 9-11): Three consecutive days of decline with progressively increasing volume (VOLUME_AVG_7D_RATIO peaking at 2.05), representing an acceleration of the downtrend and concentrated supply release.
- • Selling Exhaustion Signal (April 12): The most critical signal. Price made a new low, but volume contracted sharply compared to previous days (VOLUME_GROWTH = -27.03%, VOLUME_AVG_7D_RATIO=0.717). This aligns with the Wyckoff concept of "a Secondary Test or new low on diminished volume following a Selling Climax," hinting at reduced active selling pressure.
2.2 Supply-Demand Dynamics Conclusion:
The period underwent a complete cycle of "demand rebound -> supply-dominated decline -> panic selling -> selling exhaustion." The current (April 12) extremely low-volume new low is the primary evidence of a potential marginal shift in market structure, indicating rapidly waning downward supply pressure. However, demand has not yet manifested explicitly, placing the market at a fragile equilibrium point of power transition between bulls and bears.
3. Volatility and Market Sentiment
As of April 12, 2026, the underlying asset POLUSDT had an opening price of 0.09, a 7-day intraday volatility of 0.55, a 7-day intraday volatility ratio of 1.12, a 7-day historical volatility of 0.50, a 7-day historical volatility ratio of 1.22, and an RSI of 31.80.

3.1 Volatility Levels:
- • Historical Volatility (HIS_VOLA): Volatility across all periods is at extremely low levels.
HIS_VOLA_14D (0.4081)andHIS_VOLA_60D (0.5615)rank as the 19th lowest and 3rd lowest respectively over the past decade, indicating the market is in a state of extreme Compression. - • Intraday Volatility (PARKINSON_VOL): Also at historical lows.
PARKINSON_VOL_60D (0.6306)ranks as the 5th lowest. - • Volatility Ratios: Both
HIS_VOLA_RATIO_7D_60D (0.8835)andPARKINSON_RATIO_7D_60D (0.8785)are below 1, indicating short-term volatility is lower than long-term volatility. This typically occurs during the final stages of prolonged decline or consolidation, reflecting极度压抑 (extremely depressed) sentiment and potential酝酿变盘 (imminent directional change).
3.2 Market Sentiment and RSI:
- •
RSI_14stood at 31.80 on April 12th, in the weak zone but not yet in extreme oversold territory (<30). Throughout the decline, RSI failed to sustain rebounds within the 40-50 zone, showing weakness. Currently, a minor potential bullish divergence is forming (price makes a new low, RSI does not), but requires confirmation.
3.3 Sentiment Conclusion:
Combining volatility data and RSI, market sentiment is in a state of extreme compression and pessimism. Volatility hitting multi-year lows suggests low market participation and冷清 (quiet) trading, often a hallmark preceding significant trend reversals (compression often precedes expansion).
4. Relative Strength and Momentum Performance
- • Momentum Universally Negative: Returns across all periods are deeply negative:
WTD_RETURN(-8.71%),MTD_RETURN(-9.21%),QTD_RETURN(-9.21%),YTD(-17.61%),TTM_12(-56.47%). The asset shows weakness across all timeframes, with no中期 (medium-term) momentum support. - • Momentum Validation: The extremely negative momentum data aligns with the conclusions of a downtrend and bearish alignment, reinforcing the assessment of a长期弱势格局 (long-term weak structure). Any potential rebound in its early stages should be classified as an oversold bounce, not a trend reversal.
5. Large Investor ("Smart Money") Behavior Identification
Based on volume-price and volatility analysis, the inferred behavior path of large investors is as follows:
- 1. Distribution (Mid-to-Late February): Around the 0.1100-0.1180 range, smart money distributed on the rally (high-volume stagnation at highs).
- 2. Leading the Decline and Creating Panic (March - Early April): Sustained selling pressure and breakdowns at key levels triggered panic selling among retail investors. The high-volume decline on April 9-11 was the climax of this process, where smart money may have absorbed部分恐慌盘 (some panic selling).
- 3. Current Inferred Behavior (Critical):
- • Cessation of Active Selling: The low-volume new low on April 12th is the core signal. It indicates that large selling pressure (supply) is unwilling or unable to continue selling at lower prices at this level. Smart money may have closed or hedged most of their short positions in this area.
- • Tentative Accumulation/Observation: The market has entered an极端冷清 (extremely quiet) state of neglect (volatility at new lows). Smart money is likely awaiting a clear "test" or "spring" signal to confirm whether supply is truly exhausted before initiating long positions. Their current behavior leans more towards observation and preparation rather than aggressive buying.
6. Support/Resistance Level Analysis and Trading Signals

6.1 Key Price Levels:
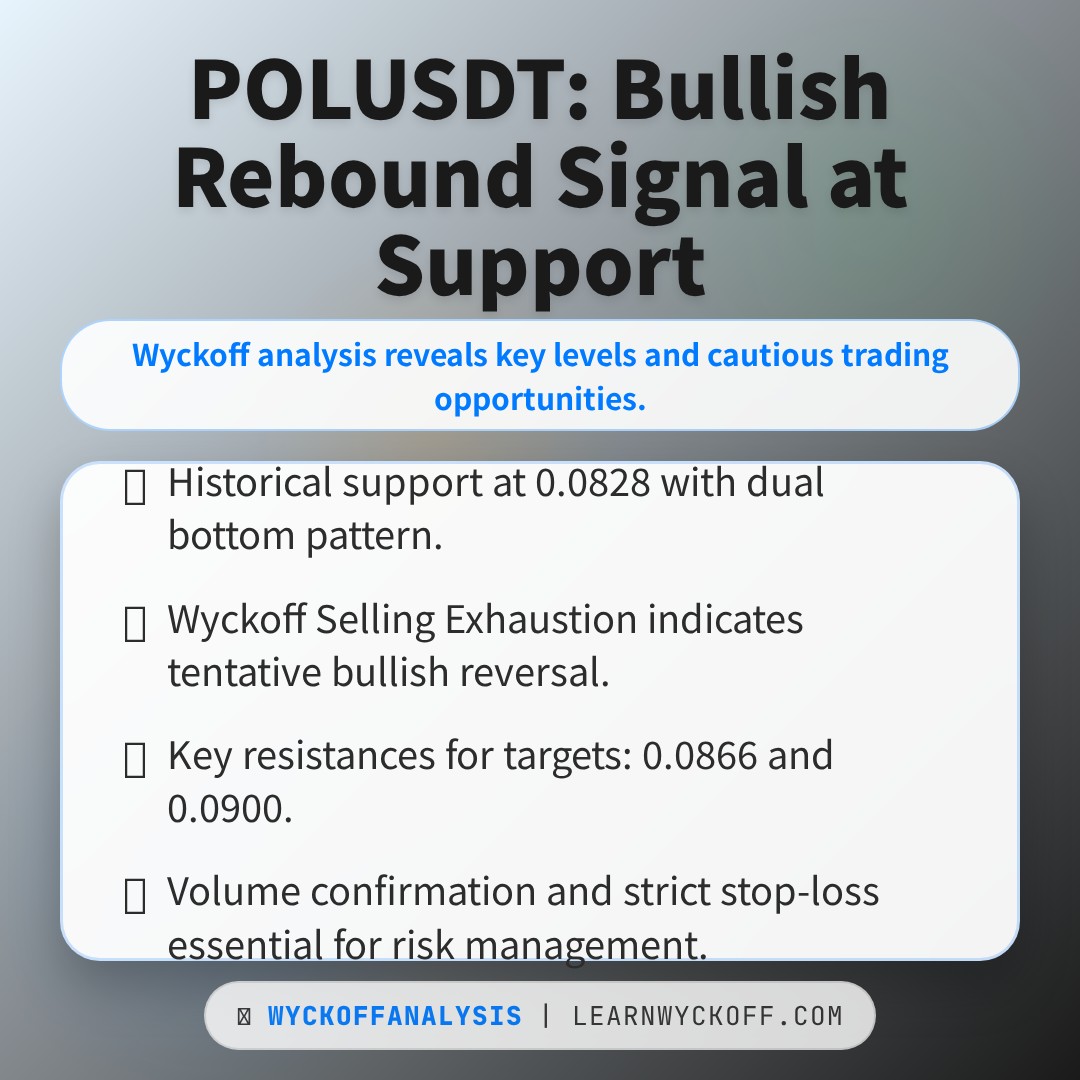
- • Immediate Support: 0.0828 (current price and historical low). No historical data support below, representing a psychological and technical双重底部 (dual bottom).
- • Near-Term Resistance:
- • R1: 0.0838-0.0844 (low area from April 10-11).
- • R2: 0.0855-0.0866 (closing price congestion zone from April 9-11).
- • R3: 0.0889-0.0900 (previous support from February 11th and multiple tests in late March, now transformed into strong resistance).
- • Strong Resistance: 0.0950-0.1000 (60-day MA and lower boundary of the March consolidation range).
6.2 Comprehensive Trading Signals and Operational Recommendations:
Primary Current Signal: Cautiously Bullish / Seeking Rebound Opportunity, but Trend Remains Bearish.
This is a left-side, tentative bullish signal based on a Wyckoff event (Selling Exhaustion), suitable for traders with higher risk tolerance. Trend traders should continue waiting for clearer right-side reversal signals.
Operational Recommendations:
- 1. Scenario One (Aggressive):
- • Entry Condition: Price consolidates or shows a minor rebound within the 0.0828-0.0840 zone, followed by a "high-volume bullish candle" (volume higher than the previous day, closing price above opening price), reclaiming 0.0844.
- • Entry Point: Light position entry on a pullback that holds above the 50% level of the bullish candle after its formation.
- • Stop Loss: Firmly placed below 0.0820 (below the historical low).
- • Profit Target: Initially aim for R2 (0.0866), then R3 (0.0900).
- 2. Scenario Two (Conservative):
- • Entry Condition: Wait for a "Spring" or "Secondary Test" signal. This means price retests the 0.0830 area again, but with volume significantly lower than the panic volume of April 9-11, and quickly recovers.
- • Entry Point: Enter on a volume-backed breakout above the high of the day where the secondary test is confirmed.
- • Stop Loss: Below the low of the secondary test.
- • Profit Target: As above.
- 3. Watch Condition: If the price continues to横盘 (move sideways) near 0.0828 on low volume without clear demand signals, maintain a观望 (watchful) stance.
Future Validation Points (Confirming/Invalidating Current Assessment):
- • Confirming Signals (Bullish):
- • Demand Emergence: Single or multiple days of rising price with expanding volume (VOLUME_AVG_7D_RATIO > 1.2), solidifying above 0.0866.
- • Successful Test: A low-volume retest near 0.0840 holds, followed by renewed upward movement.
- • Volatility Expansion: Historical volatility (especially 7-day, 14-day) begins to rise moderately from extreme lows, accompanied by price increase.
- • Invalidating Signals (Bearish):
- • Supply Reemergence: Price breaks below 0.0820 with expanding volume at current levels, indicating supply is not exhausted, greatly increasing the probability of a下跌中继 (continuation pattern within a downtrend).
- • Weak Rebound: Any upward反弹 (bounce) fails to be accompanied by increasing volume and fails before reaching 0.0889.
- • If invalidated, the downtrend is likely to continue, requiring reassessment of the next target based on the decline's rhythm.
Risk Notice: This report is based on historical data and Wyckoff principle analysis; all signals are probabilistic events. The cryptocurrency market is highly volatile. Even with Selling Exhaustion signals, price may linger near lows or experience extreme fluctuations until demand clearly enters. Please strictly execute position sizing and stop-loss discipline according to your personal risk tolerance.
Disclaimer: The content of this report/analysis is solely market analysis and research based on publicly available information and does not constitute any investment advice or operational guidance. The author strives for objectivity and fairness but makes no guarantees regarding accuracy or completeness. Markets involve risks; investing requires caution. Any investment actions based on this report are undertaken at your own risk.
Thank you for your attention! Daily Wyckoff volume-price market interpretations are released punctually before the 8:00 AM market open. Please leave comments and share; your recognition is crucial. Let us work together to perceive market signals.
Member discussion: