Understood. As a quantitative trading researcher proficient in the Wyckoff Method, I will author a comprehensive and in-depth quantitative analysis report based on the BNBUSDT data and historical ranking metrics you have provided.
BNBUSDT Quantitative Analysis Report (Based on the Wyckoff Method)
Product Code: BNBUSDT
Analysis Date Range: 2026-02-11 to 2026-04-12
Report Generation Date: 2026-04-13
1. Trend Analysis and Market Phase Identification
As of April 12, 2026, BNBUSDT opened at 607.06, closed at 596.09. The 5-day Moving Average is 607.38, 10-day MA is 600.37, 20-day MA is 611.31. Daily Change: -1.81%, Weekly Change: -0.90%, Monthly Change: -3.46%, Quarterly Change: -3.46%, Year-to-Date Change: -31.03%.

- • Moving Average Alignment and Trend Judgment:
- • Long-term Trend (Bearish): Throughout the analysis period, the price (closing at 596.09) has consistently traded below all major moving averages (MA_5D: 607.38, MA_10D: 600.37, MA_20D: 611.31, MA_30D: 625.08, MA_60D: 624.44), forming a clear and stable bearish alignment. This indicates the market's long-term trend is in a definitive downtrend channel.
- • Medium-term Dynamics: Since late March, the MA_5D and MA_10D have flattened and intertwined around 600, while the longer-term MA_20D, MA_30D, and MA_60D continue their steady descent. This suggests the primary downtrend remains intact, but the momentum of the medium-term decline has slowed. The market may be entering a consolidation/basing phase or a continuation (pausing) phase within the downtrend.
- • Price Action and Phase Identification:
- • Primary Phase (2026-02-11 to 2026-04-02): The price declined from around 825 (the starting value of MA_30D) to near 570. Although there were rebounds during this period (e.g., +7.85% on Feb 25), subsequent highs were progressively lower. This aligns with the characteristics of the "Distribution" or "Markdown" phase in Wyckoff theory, where supply consistently dominates the market.
- • Current Phase (From 2026-04-02 to present): On April 2nd, a high-volume (297,618) long bearish candlestick (-4.47%) appeared, creating a new phase low of 570.31, followed by a rebound. Considering subsequent volume-price behavior (see below), this area might be forming a "Panic Selling" or "Preliminary Accumulation" phase. The failure to continue plunging after making a new low, coupled with a rebound test, suggests potential demand emerging at the extreme lows.
2. Volume-Price Relationship and Supply-Demand Dynamics
As of April 12, 2026, BNBUSDT opened at 607.06, closed at 596.09, volume was 94792.30, daily change was -1.81%, volume was 94792.30, 7-day average volume was 116353.09, 7-day volume ratio was 0.81.

- • Key Day Analysis:
- 1. High-Volume Plunge (Panic Selling - 2026-04-02): The price fell 4.47% on that day, with volume surging 135.16% to 297,618. The
VOLUME_AVG_60D_RATIOreached a high of 1.798 (Historical Rank: The 19th highest volume increase in nearly a decade). This is a classic panic selling signal, indicating a massive outflow of holdings driven by fear. Wyckoff Interpretation: This is a potential point for an "Automatic Rally" (AR) or "Panic Selling" (PS), a sign that a downtrend may be nearing its end. - 2. High-Volume Rise (Demand Test - 2026-04-07): The price rose significantly by 3.33% on volume of 163,527, with a
VOLUME_AVG_14D_RATIOof 1.427. This notable high-volume rise following the panic low indicates active buying at this price level, suggesting demand is beginning to appear. - 3. Low-Volume Rebound/Decline (Insufficient Demand/Exhausted Supply - Recent): From April 9th to 12th, the price fluctuated narrowly within the 600-620 range with continuously shrinking volume. On April 12th, the price fell 1.81% on volume of 94,792, with a
VOLUME_AVG_60D_RATIOof only 0.719. Wyckoff Interpretation: This can be interpreted in two ways: a) Insufficient demand during the rebound, unable to push prices higher; b) Shrinking supply during the decline, indicating reduced selling pressure. Considering the price did not make a new low, the latter interpretation is more likely, pointing to a "Test" phase where supply is weakening.
- 1. High-Volume Plunge (Panic Selling - 2026-04-02): The price fell 4.47% on that day, with volume surging 135.16% to 297,618. The
- • Supply-Demand Strength Transition:
- • The data clearly shows a transition from "Absolute Supply Dominance" (sustained decline in Feb-Mar) -> "Panic Selling" (April 2nd) -> "Initial Demand Entry" (April 7th) -> "Supply Exhaustion Test" (April 9-12). The volume ratio
VOLUME_AVG_60D_RATIOrapidly declined from an extreme high of 1.798 on April 2nd to 0.719 on April 12th, indicating that the abnormally active selling has subsided.
- • The data clearly shows a transition from "Absolute Supply Dominance" (sustained decline in Feb-Mar) -> "Panic Selling" (April 2nd) -> "Initial Demand Entry" (April 7th) -> "Supply Exhaustion Test" (April 9-12). The volume ratio
3. Volatility and Market Sentiment
As of April 12, 2026, BNBUSDT opened at 607.06. The 7-day Intraday Volatility is 0.34, 7-day Intraday Volatility Ratio is 0.99, 7-day Historical Volatility is 0.38, 7-day Historical Volatility Ratio is 1.01, RSI is 41.75.

- • Volatility Levels and Changes:
- • Historical Volatility (HIS_VOLA): After peaking at a recent high of 0.372 on April 2nd,
HIS_VOLA_7Dhas now retraced to 0.382. Its ratio to the 14-day volatility,HIS_VOLA_RATIO_7D_14D, is 1.007, indicating short-term volatility has retreated from the abnormally high levels seen during the panic (this ratio was 1.064 on April 2nd) and returned to levels similar to medium-term volatility. This suggests market sentiment is recovering from extreme panic. - • Intraday Volatility (PARKINSON_VOL):
PARKINSON_VOL_7Dis 0.341, with a 7-day/14-day ratioPARKINSON_RATIO_7D_14Dof 0.988. This ratio was as low as 0.593 on February 13th (Historical Rank: The 15th lowest 7-day/14-day historical volatility ratio in nearly a decade), indicating the market was in a low-volatility, grinding decline at that time. The current ratio near 1 shows intraday volatility is at normal levels.
- • Historical Volatility (HIS_VOLA): After peaking at a recent high of 0.372 on April 2nd,
- • Overbought/Oversold (RSI):
- • RSI_14 dropped to a low of 33.12 on April 2nd, approaching the oversold region (30) but not reaching extreme oversold (<20). It then rebounded to 41.75 by April 12th. This indicates market sentiment has moved away from its short-term low point but remains in a weak zone, not constituting a strong contrarian overbought signal, leaving room for potential further rebound.
4. Relative Strength and Momentum Performance
- • Periodic Return Analysis:
- • Long-term Momentum (Extremely Weak): The
YTDreturn of -31.03% andTTM_12of -0.20% confirm a significant long-term weakness. - • Medium-term Momentum (Weak but Declining Momentum Slowing): The
QTDandMTDreturns are both -3.46%. Although negative, they represent a significant narrowing of the decline compared to the YTD loss. This indicates the downward momentum in the current quarter (since April) has clearly weakened relative to the start of the year. - • Short-term Momentum (Attempting to Base): The
WTD_RETURNis -0.90%. Notably, for the week ending April 7th, the weekly return briefly turned positive (0.43%), the first time since mid-February, though it could not be sustained. This shows the struggle between bulls and bears at the current price level.
- • Long-term Momentum (Extremely Weak): The
- • Conclusion: BNBUSDT shows weakness across all timeframes. However, the key positive signal is that the negative momentum gap between the extreme long-term (YTD) and medium-term (QTD/MTD) is narrowing, and short-term (WTD) shows signs of a struggling stabilization. This aligns with the observation of demand absorption in the 570 region.
5. Large Investor (Smart Money) Behavior Identification
- • Key Behavioral Inferences:
- 1. Absorption During Panic Selling (2026-04-02): The high-volume long bearish candle itself is a sign of public panic. However, Wyckoff theory posits that a true panic low needs to be confirmed by subsequent "secondary tests" and "strong rallies." Smart money does not loudly buy during a crash but may absorb panic selling at extreme prices when liquidity dries up. The massive volume on April 2nd, coupled with the historically high volume growth rank (19th), may record some smart money accumulation behavior at the bottom.
- 2. Testing After Accumulation (2026-04-09 to 04-12): Following the demand demonstration from the high-volume rise on April 7th, the market experienced consecutive small-range candles with shrinking volume. This fits the characteristics of a "Shakeout" or "Test": After preliminary accumulation, smart money may create an illusion of weakness (low-volume decline) to induce weak holders to sell, thereby collecting more cheap筹码 (holdings). The
VOLUME_AVG_60D_RATIOreached a historical low rank of #1 lowest in nearly a decade (0.719 on April 12th). Extreme low volume is a typical feature of the "Test" phase, indicating scarce floating supply.
- • Comprehensive Intent Judgment: The sequence of large investor operations tentatively appears as: Preliminary accumulation around 570 utilizing public panic -> A high-volume rally to move away from the cost zone and attract attention -> Subsequent low-volume consolidation for shakeout and secondary accumulation. The market is likely currently in this "Test/Shakeout" phase.
6. Support/Resistance Level Analysis and Trading Signals

- • Key Price Levels:
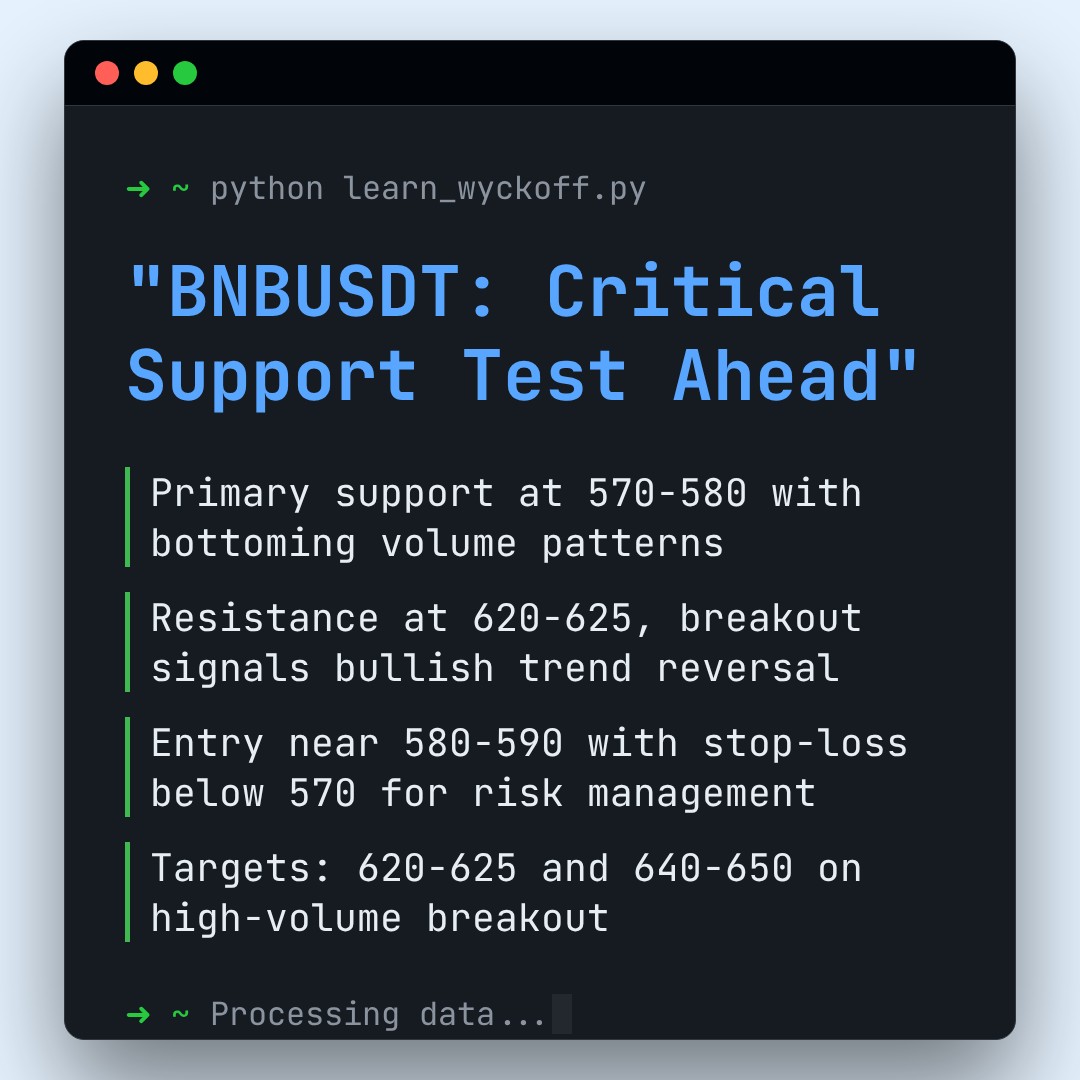
- • Primary Support Zone: 570.00 - 580.00. Formed by the panic low on 2026-04-02 (570.31) and the bottom area tested multiple times recently. This is the critical line for judging whether accumulation is valid. Historical ranking data supports this: The volume characteristics in this zone (extreme high volume followed by extreme low volume) possess typical bottoming features.
- • Primary Resistance Zone: 620.00 - 625.00. Formed by multiple rebound highs following the decline from the 2026-03-23 bounce high (650.85) (e.g., 629.42 on Mar 31, 620.10 on Apr 7), and currently coincides with the MA_20D (611.31) and MA_30D (625.08). A decisive breakout above this zone would be the first significant signal of trend strength reversal.
- • Secondary Resistance Zone: 640.00 - 650.00. The lower boundary of the mid-March consolidation platform.
- • Comprehensive Trading Signals and Operational Recommendations:
- • Wyckoff Event Synthesis: The market may have completed "Panic Selling" and is currently in a "Secondary Test" phase following an "Automatic Rally", potentially constructing an accumulation range.
- • Core View: Cautiously Bullish, Awaiting Test Confirmation. The current strategy should focus on seeking accumulation opportunities near support levels rather than chasing rallies.
- • Specific Operational Recommendations:
- 1. Entry Condition: Consider establishing long positions in tranches when the price retraces to the 580-590 zone (testing support) and shows signs of low-volume stabilization (e.g., small-bodied candles with volume below the 60-day average) or a high-volume rebound.
- 2. Stop-Loss Setting: Strictly place stops below the key support at 570 (e.g., 565). If the price breaks below this level on high volume, the "accumulation" hypothesis is invalidated, and positions should be exited decisively.
- 3. Target Outlook: The initial target is the first resistance zone at 620-625. If this can be broken through on high volume, the next target would be 640-650.
- 4. Observation/Exit Signal: If the price rallies directly to the 620-625 resistance zone on low volume and shows signs of stalling (e.g., long upper wick, bearish close), it is a signal to reduce or exit short-term positions.
- • Future Validation Points:
- 1. Confirmation Signal: After finding support in the 570-590 zone, the price sees another high-volume bullish candle (expanding demand) similar to April 7th and successfully breaks above the 620-625 resistance zone.
- 2. Invalidation Signal: If the price breaks below the 570 support, especially accompanied by renewed high volume, it would signal a resumption of the downtrend, invalidating the accumulation hypothesis, and a shift to a bearish outlook would be required.
Disclaimer: This report/analysis is solely market analysis and research based on publicly available information and does not constitute any investment advice or operational guidance. The author strives for objectivity and fairness in the content but makes no guarantees regarding its accuracy or completeness. The market carries risks; investment requires caution. Any investment actions based on this report are taken at one's own risk.
Thank you for your attention! Daily Wyckoff Volume-Price Market Insights are published promptly at 8:00 AM before the market opens. We appreciate your comments and shares; your recognition is crucial. Let's see the market signals together.
Member discussion: