Alright, following your instructions. Below is my comprehensive and in-depth analysis report on XLK from the perspective of a Wyckoff quantitative trading researcher.
XLK Quantitative Analysis Report (Based on Wyckoff Method)
Ticker: XLK
Analysis Date Range: 2026-02-09 to 2026-04-10
Report Generation Date: 2026-04-11
1. Trend Analysis and Market Phase Identification
As of 2026-04-10, the underlying asset XLK had an opening price of 142.50, a closing price of 142.62, a 5-day moving average of 138.79, a 10-day moving average of 135.17, a 20-day moving average of 136.31, a daily change of 0.39%, a weekly change of 4.88%, a monthly change of 7.31%, a quarterly change of 7.31%, and a yearly change of -0.94%.

- • Moving Average Alignment Analysis: By the end of the analysis period (2026-04-10), the price (CLOSE: 142.62) had risen above the 5-day (MA_5D: 138.79), 10-day (MA_10D: 135.17), 20-day (MA_20D: 136.31), and 30-day (MA_30D: 137.34) moving averages, indicating a short-term bullish alignment. However, the critical 60-day moving average (MA_60D: 140.09) remained above the price. Furthermore, throughout the analysis period, the 60-day MA declined consistently from 163.05 in early February to 140.09, clearly signaling that the long-term downtrend has not yet reversed. The price briefly fell below all moving averages in late March before staging a strong rebound. Conclusion: The market is in a strong technical rebound within a long-term downtrend. The short-term structure has strengthened, but a stable long-term bullish alignment has not yet formed.
- • Moving Average Crossover Signals: Key short-term bullish crossovers occurred during the rebound from late March to early April. For example, on April 1st, the MA_5D (131.92) crossed above the MA_20D (136.73), issuing a short-term buy signal. Subsequently, the MA_10D also crossed above both the MA_20D and MA_30D. This repair of the short-term moving average system from a bearish to a bullish alignment confirms the strengthening of rebound momentum.
- • Market Phase Inference (Wyckoff-based): The analysis period clearly demonstrates a Wyckoff-style process of "Panic Sell-off" -> "Automatic Rally".
- • Panic Sell-off (Mid-to-late March 2026): The price plummeted from 139.54 on March 17th to 127.50 on March 30th, a decline of 8.6%, accompanied by significantly increased volume (e.g., volume of 154 million shares on March 26th, above the 30-day average). This aligns with the characteristics of a panic sell-off in the final stages of a Wyckoff decline.
- • Automatic Rally (Late March to early April 2026): Following the formation of the panic low at 127.50, the market experienced a strong, sustained rebound, with prices rising over 11% in eight trading sessions, recovering most losses. This is a natural bounce from oversold conditions.
- • Current Phase Assessment: The price has rebounded to near a prior congestion zone (140-145), facing key resistance. Combined with subsequent price-volume behavior (see below), the market may be transitioning from the "Automatic Rally" towards the upper boundary of a "Secondary Test" or "Accumulation" area. However, caution is warranted for signs of rebound momentum exhaustion, indicating early stages of Distribution.
2. Price-Volume Relationship and Supply-Demand Dynamics
As of 2026-04-10, the underlying asset XLK had an opening price of 142.50, a closing price of 142.62, volume of 9309284, a daily change of 0.39%, volume of 9309284, a 7-day average volume of 12721263.86, and a 7-day volume ratio of 0.73.

- • Key Day Analysis (Wyckoff Principles):
- 1. Panic Sell-off Day (Supply Dominated): 2026-03-12, price fell 1.84% on a volume of 32.37 million shares, which was 1.78 times the 30-day average volume (18.19 million shares) (
VOLUME_AVG_30D_RATIO: 1.78). A classic example of high-volume decline, indicating strong supply (selling) pressure. - 2. Panic Climax and Demand Counterattack Day: 2026-03-30, price hit a phase low of 127.50 on a high-volume decline (
VOLUME_AVG_30D_RATIO: 1.00). The next day (03-31), the price surged 4.24% on high volume, with volume reaching 19.41 million shares (VOLUME_AVG_30D_RATIO: 1.08). This pattern of a "high-volume decline low" followed immediately by a "high-volume surge" is a classic Wyckoff signal of panic selling being absorbed by significant demand. - 3. Initial Supply Signal During Rebound: 2026-04-08, the price gapped higher, intraday hit a new rebound high of 143.56, but closed at 141.69, forming a long upper shadow on the daily candlestick, with volume expanding to 13.36 million shares (
VOLUME_AVG_30D_RATIO: 0.75). This is high-volume stagnation, indicating notable supply pressure emerging at rebound highs. - 4. Demand Exhaustion Signal: On 2026-04-09 and 04-10, the price continued to make minor new highs, but volume shrank to 8.24 million and 9.31 million shares respectively, with
VOLUME_AVG_30D_RATIOdropping to 0.46 and 0.53. This is a typical low-volume advance, showing insufficient follow-through demand and weakening internal momentum of the rebound.
- 1. Panic Sell-off Day (Supply Dominated): 2026-03-12, price fell 1.84% on a volume of 32.37 million shares, which was 1.78 times the 30-day average volume (18.19 million shares) (
- • Supply-Demand Strength Shift: Volume ratio data clearly shows the shift in supply-demand forces. During the March decline,
VOLUME_AVG_60D_RATIOrepeatedly exceeded 1.5, indicating heavy selling pressure. Entering the April rebound, this ratio consistently remained below 0.7, dropping to extremely low levels of 0.42 and 0.47 on 04-09/10. This suggests that the concentrated buying (likely institutional) that fueled the initial rebound has subsided. The market has entered a low-volume push phase, indicating an unstable foundation for the advance.
3. Volatility and Market Sentiment
As of 2026-04-10, the underlying asset XLK had an opening price of 142.50, a 7-day intraday volatility of 0.22, a 7-day intraday volatility volume ratio of 0.90, a 7-day historical volatility of 0.19, a 7-day historical volatility volume ratio of 0.52, and an RSI of 60.11.

- • Volatility Level and Change: At the beginning of the analysis period (February), the 60-day historical volatility (
HIS_VOLA_60D) was at an extreme high of 1.72. According to historical ranking data, this value ranks between the 17th and 20th percentile over the past decade, indicating a state of extreme panic and high uncertainty. By April,HIS_VOLA_60Dhad significantly retreated to 0.31, while the 7-day volatility (HIS_VOLA_7D) fell further to a low of 0.19. Parkinson volatility showed the same trend, withPARKINSON_VOL_7Ddropping from above 0.33 in February to 0.22 on April 10th. The sharp contraction in volatility from historical highs indicates that market panic has significantly eased, entering a relatively calm period. - • Volatility Structure Anomaly: Volatility ratios provide deeper insight. During the February-March decline,
HIS_VOLA_RATIO_7D_60Dwas consistently below 0.3, indicating short-term volatility was much lower than long-term, characteristic of a grinding decline. Recently, this ratio has recovered to around 0.6, narrowing the gap between short-term and long-term volatility, reflecting the market's shift from a one-sided decline to a choppy rebound. - • Overbought/Oversold Status (RSI Confirmation): The RSI_14 reached a low of 29.33 on March 30th, entering a severely oversold zone, providing a technical basis for the subsequent rebound. As the rebound progressed, the RSI rose to 60.11 by April 10th, exiting oversold territory but not yet entering overbought (>70). This suggests the rebound still has room sentiment-wise but has moved away from the optimal oversold entry zone.
4. Relative Strength and Momentum Performance
- • Periodic Return Analysis: Momentum performance closely aligns with price action. As of April 10th, short-term momentum is extremely strong: the weekly return (
WTD_RETURN) is 4.88%, and the monthly return (MTD_RETURN) is 7.31%. Mid-term momentum has significantly improved: the quarterly return (QTD_RETURN) sharply recovered from -11.44% at the end of March to 7.31%. However, long-term momentum remains weak: the year-to-date return (YTD) is still -0.94%. - • Momentum Conclusion: XLK demonstrates powerful short-term rebound momentum, driven by demand influx following extreme oversold conditions. However, the rebound has not yet fully reversed the long-term weakness of the year-to-date decline. The momentum structure is consistent with the market phase assessment of a "strong rebound within a long-term downtrend."
5. Large Investor (Smart Money) Behavior Identification
- • Accumulation Behavior: Around the "panic sell-off low" on March 30th-31st, a sequential combination of extremely high-volume decline and extremely high-volume advance occurred. Historical ranking data shows that the trading volume on March 3rd and March 12th ranked among the highest in the past decade (13th and 17th percentile). This strongly suggests that large capital (smart money) was actively absorbing supply (accumulating) during the market's panic selling. They utilized retail panic to accumulate positions at low levels.
- • Distribution Suspicion: Entering April, after prices rebounded to the 140-143 zone (a prior congestion zone and the 60-day MA resistance area), signs of high-volume stagnation (04-08) and low-volume advance (04-09/10) emerged. Smart money may be utilizing the strong rebound sentiment and optimistic retail buying to conduct Distribution at the resistance zone, i.e., partially taking profits on positions accumulated at lower levels. The sharp contraction in volume suggests genuine institutional demand may have withdrawn, with the market now driven primarily by inertia and residual buying.
- • Behavior Inference: In summary, smart money successfully executed an accumulation operation at the panic low in late March. During the rapid rebound in early April, they likely began distributing or ceased buying near key resistance levels, shifting to a观望 stance.
6. Support/Resistance Level Analysis and Trading Signals

- • Key Support Levels:
- • S1 (Strong Support): 127.50 - The absolute low of this panic sell-off and the clear area of smart money介入. A future retest of this level accompanied by low-volume stabilization would present a significant secondary test buying opportunity.
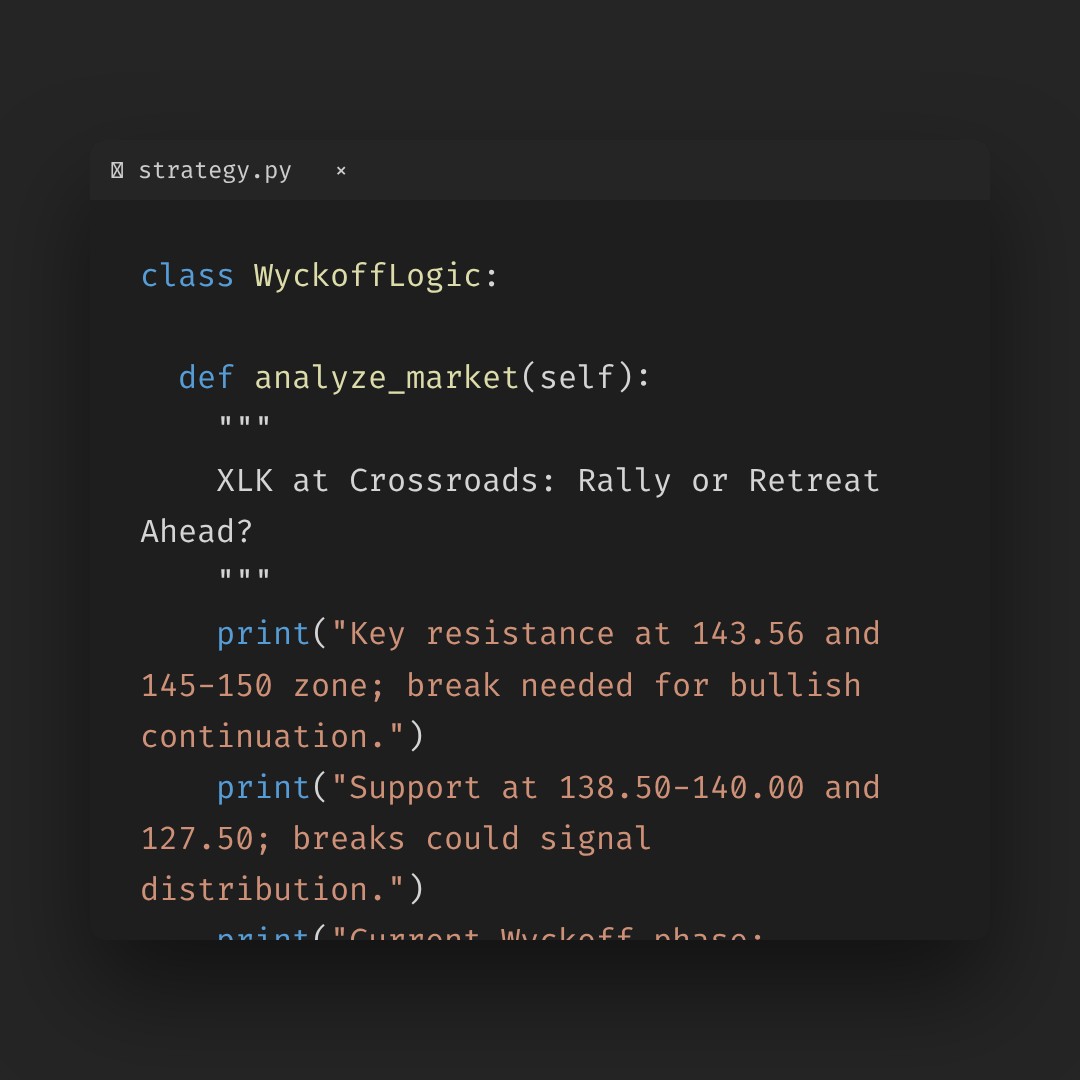
- • S2 (Dynamic Support): 138.50-140.00 - The recent rebound's consolidation platform and the convergence area of the 20/30-day MAs, also the breakout point in early April. A break below this zone would signify damage to the short-term rebound structure.
- • Key Resistance Levels:
- • R1 (Near-term Resistance): 143.56 - The rebound high set on 04-08, where high-volume stagnation occurred.
- • R2 (Core Resistance): 145.00-150.00 - The lower boundary of the February to early March congestion platform, also the area where the declining 60-day MA (currently 140.09) will provide downward pressure, constituting strong resistance.
- • Comprehensive Wyckoff Events and Trading Signals:
- • Current Event Assessment: The market may currently be in the initial phase of "Secondary Test (ST)" or "Distribution" following the "Automatic Rally (AR)." The high-volume stagnation on 04-08 can be seen as a sign of "Preliminary Supply (PSY)" or "Buying Climax (BC)."
- • Trading Signals and Recommendations:
- 1. Bearish/Watchful Signal: Given the price has rebounded to a key resistance zone and shows the demand exhaustion组合 of "high-volume stagnation + low-volume advance," chasing the rally here is not advisable. It is recommended that long positions consider taking partial profits or setting tight stop-losses in this area.
- 2. Bullish Signal Condition: If the price can break through R1 (143.56) decisively with strong volume (VOLUME_AVG_30D_RATIO > 1.2) and hold above it, the rebound could extend towards the R2 zone, presenting a new long opportunity.
- 3. Bearish Signal Condition: If the price at the current level experiences another high-volume decline and breaks below S2 (138.50), it would largely confirm a Distribution structure, allowing consideration for establishing short positions, targeting S1.
- 4. Ideal Long Entry Point: Waiting for a price retest of the S2 or S1 support levels, accompanied by Wyckoff bullish signals such as "low-volume decline (supply exhaustion)" or "renewed high-volume stabilization (demand reappearance)," would present a better risk-reward ratio for long entry.
- • Future Confirmation Points:
- • Confirming Bullish: Requires observing the price consolidating充分 near R1 followed by a high-volume breakout.
- • Confirming Bearish/Distribution: Requires observing the price failing to突破 R1 and beginning to show consecutive, expanding volume down days (Sign of Weakness, SOW).
- • Confirming Continued Accumulation: Requires observing a price retest of support accompanied by急剧萎缩 volume, indicating selling exhaustion.
Disclaimer: This report is based entirely on quantitative and Wyckoff principle analysis of the provided historical data and does not constitute any investment advice. Financial markets involve risks, and past performance is not indicative of future results. Investors should exercise independent judgment and make decisions prudently.
Thank you for your attention! Wyckoff Price-Volume Market Interpretation is released daily at 8:00 AM before the market opens. Please feel free to leave a comment, share, and forward. Your recognition is crucial. Let's work together to see the market signals clearly.
Member discussion: