As a quantitative trading researcher proficient in the Wyckoff Method, I will draft a comprehensive, in-depth quantitative analysis report based on the provided TONUSDT data and historical ranking indicators.
Quantitative Analysis Report: TONUSDT
Product Code: TONUSDT
Analysis Period: 2026-02-09 to 2026-04-10
Report Generation Date: 2026-04-11
1. Trend Analysis & Market Phase Identification
As of April 10, 2026, the underlying asset TONUSDT opened at 1.25, closed at 1.30, with moving averages: MA_5D 1.24, MA_10D 1.24, MA_20D 1.25. Performance metrics: Daily change +4.49%, Weekly change +5.08%, Monthly change +6.80%, Quarterly change +6.80%, Year-to-date change -21.46%.

Observations & Deductions:
- 1. Moving Average Alignment: As of the analysis end date (2026-04-10), the price (CLOSE=1.303) is below all major moving averages (MA_5D=1.243, MA_10D=1.238, MA_20D=1.251, MA_30D=1.268, MA_60D=1.305). The MAs are in a standard bearish alignment (MA_5D < MA_10D < MA_20D < MA_30D < MA_60D), clearly indicating the market is in a long-term downtrend.
- 2. Trend Evolution:
- • Initial Decline Phase (Feb 9 - Mar 1): Price fell continuously from 1.359 to the year-to-date low of 1.201 (Mar 1), with moving averages diverging downward.
- • Low-Level Consolidation & Initial Rebound (Mar 2 - Mar 23): Price consolidated within a wide range of 1.20-1.35, forming a preliminary base structure. MA_5D and MA_10D began to flatten and intertwine, but longer-term MAs (MA_20D and above) remained downward, indicating weakening downward momentum but not yet a trend reversal.
- • Secondary Test & Structure Consolidation (Mar 24 - Apr 9): Price retreated again but did not decisively break below the previous low of 1.201, bottoming at 1.235 (Apr 10). Volume shrank significantly during this period (see below), and volatility dropped to historically extreme lows. This aligns with the Wyckoff concept of a Secondary Test (ST) or Final Shakeout within an "Accumulation" range.
- • Breakout Attempt (Apr 10): Price closed with a +4.49% bullish candle, moving upward out of the recent consolidation range and above all short-term moving averages (MA_5D, MA_10D, MA_20D). This is a potential Sign of Strength (SOS) signal.
Wyckoff Market Phase Inference:
Synthesizing trend and subsequent price-volume analysis, the market likely completed the transition from a "Downtrend" to an "Accumulation Phase" between March and early April 2026. The current signal (Apr 10) suggests the market may be attempting to leave the accumulation range and enter the early stages of a potential "Markup Phase". However, subsequent volume confirmation is required.
2. Price-Volume Relationship & Supply-Demand Dynamics
As of April 10, 2026, the underlying asset TONUSDT opened at 1.25, closed at 1.30, with volume 6479818.09, daily change +4.49%, volume 6479818.09, 7-day average volume 5445209.15, 7-day volume ratio 1.19.

Core Data Deductions:
- 1. Panic Selling & Initial Demand Emergence (March):
- • 2026-03-01: Price plummeted -6.32% on volume of 6.47M, relatively high for the recent period. Combined with the new price low, this represents a classic Selling Climax (SC), indicating concentrated supply release.
- • 2026-03-20: Price rebounded +2.86% on surging volume of 8.92M (
VOLUME_AVG_7D_RATIO=2.05), the highest single-day volume in the data period. A massive rebound during the secondary test indicates strong demand absorbing supply at lower levels, a clear signal of an Automatic Rally (AR).
- 2. Supply Exhaustion & Demand Testing (Late March - Early April):
- • 2026-03-27 to 2026-04-04: Volume continuously contracted, with many days below 3M. Notably on 2026-04-04, volume was only 1.88M, the 4th lowest extreme in the data period (
WEEK_MIN_VOLUMEhistorical rank 4), and price volatility narrowed to an extreme. This marks Lack of Selling, indicating seller willingness has hit rock bottom. - • Historical Ranking Confirmation: Multiple average volume indicators (AVERAGE_VOLUME_30D, AVERAGE_VOLUME_60D) recently reached their lowest or very low historical ranks in nearly 10 years (e.g., the 60-day average volume ranked #1 lowest on Apr 9). This confirms from a long-term cycle that market activity has fallen to extreme lows, a typical precursor to a major reversal.
- • 2026-03-27 to 2026-04-04: Volume continuously contracted, with many days below 3M. Notably on 2026-04-04, volume was only 1.88M, the 4th lowest extreme in the data period (
- 3. Demand Return & Breakout (Apr 10):
- • 2026-04-10: Price increased +4.49% on volume of 6.48M, showing clear volume expansion relative to the recently extremely low average volume (
VOLUME_AVG_7D_RATIO=1.19). This is a Sign of Strength (SOS), indicating that after supply exhaustion, demand is actively entering the market.
- • 2026-04-10: Price increased +4.49% on volume of 6.48M, showing clear volume expansion relative to the recently extremely low average volume (
Supply-Demand Conclusion:
The market experienced a complete Wyckoff accumulation sequence: "Selling Climax (SC) -> Automatic Rally (AR) -> Secondary Test/Shakeout (ST) -> Lack of Selling". The high-volume bullish candle on April 10 is the clearest signal that demand is beginning to dominate the market and attempting to conclude the accumulation range.
3. Volatility & Market Sentiment
As of April 10, 2026, the underlying asset TONUSDT opened at 1.25, with volatility metrics: 7-day Parkinson Volatility 0.47 (ratio 1.11), 7-day Historical Volatility 0.36 (ratio 1.24), RSI 57.18.

Data Deductions:
- 1. Volatility Compressed to Extremes:
- • Historical Volatility (HIS_VOLA) and Parkinson Volatility across all periods dropped near their lowest levels in the data period in early April. For example,
HIS_VOLA_14Dfell to 0.269 on Apr 9, ranking the 12th lowest in nearly 10 years (WEEK_MIN_HIS_VOLA_14Drank 12);PARKINSON_VOL_7Ddropped to 0.280 on Apr 6, ranking 7th lowest. - • Volatility ratios (e.g.,
HIS_VOLA_RATIO_7D_14D) were also in historically extreme low regions in early April (e.g., rank 3rd lowest on Apr 5), indicating short-term volatility was far below medium-term volatility, plunging the market into extreme calm and indecision. This extreme Volatility Squeeze is typically a precursor to significant price movement.
- • Historical Volatility (HIS_VOLA) and Parkinson Volatility across all periods dropped near their lowest levels in the data period in early April. For example,
- 2. Sentiment Recovery from Extreme Pessimism:
- • RSI_14 hit a low of 29.87 on Mar 1, entering oversold territory, reflecting extreme pessimism.
- • Subsequently, RSI slowly rose during the March-April consolidation but never entered overbought territory. As of Apr 10, RSI recovered to 57.18, indicating sentiment has repaired from extreme pessimism to neutral-bullish, providing an emotional foundation for a potential trend change.
Sentiment Conclusion:
Market sentiment has recovered from the panic in early March, undergoing repair through prolonged volatility compression and low volume. Extremely low volatility has built up energy for a future directional move.
4. Relative Strength & Momentum Performance
Data Deductions:
- 1. Long-term Momentum Extremely Weak, Short-term Momentum Strengthening:
- • YTD return is -21.46% and TTM_12 return is -55.30%, confirming long-term weakness.
- • However, recent momentum has improved significantly: MTD_RETURN (April to date) is +6.80%, WTD_RETURN (this week) is +5.08%. Short-term momentum has turned positive and accelerated, resonating with the breakout candle on Apr 10.
- 2. Momentum Structure Change: QTD_RETURN (this quarter) is +6.80%, while YTD remains negative. This indicates that the upward momentum in the current quarter (Q2) has completely reversed the downward momentum from the beginning of the year (Q1), reflecting a positive change in quarterly momentum structure.
Momentum Conclusion:
Despite the long-term trend remaining weak, significant and synchronous signs of strengthening have emerged in short-term and quarterly momentum, mutually validating the conclusions of price breakout and improving price-volume relationships.
5. Large Investor (Smart Money) Behavior Identification
Behavioral Inferences:
- 1. Accumulation Behavior: Multiple instances of anomalous high volume (e.g., Mar 20, Feb 25) occurred near the panic lows (~1.20) in March and the subsequent consolidation range. Combined with the failure to make new lows, this clearly reveals large investors conducting planned accumulation by exploiting market panic and uncertainty. Historically low long-term average volume rankings indicate retail and weak-hand trading interest has plummeted, creating an ideal environment for smart money to accumulate positions quietly.
- 2. Testing & Shakeout: The extreme low-volume, narrow-range consolidation from late March to early April represents smart money testing market supply. The extremely low volume proves floating supply has been effectively cleared.
- 3. **Initiation Signal:**The high-volume rise on April 10 is a clear display of operational intent by smart money to conclude accumulation and begin pushing the price into a markup phase. They are no longer content with low-level collection but are initiating active buying to lift the price away from their cost zone.
Core Conclusion: The data clearly depicts the entire smart money process in the 1.20-1.26 price range: "Absorbing during panic -> Accumulating during consolidation -> Testing during silence -> Initiating on high volume."
6. Support/Resistance Level Analysis & Trading Signals

Key Price Levels:
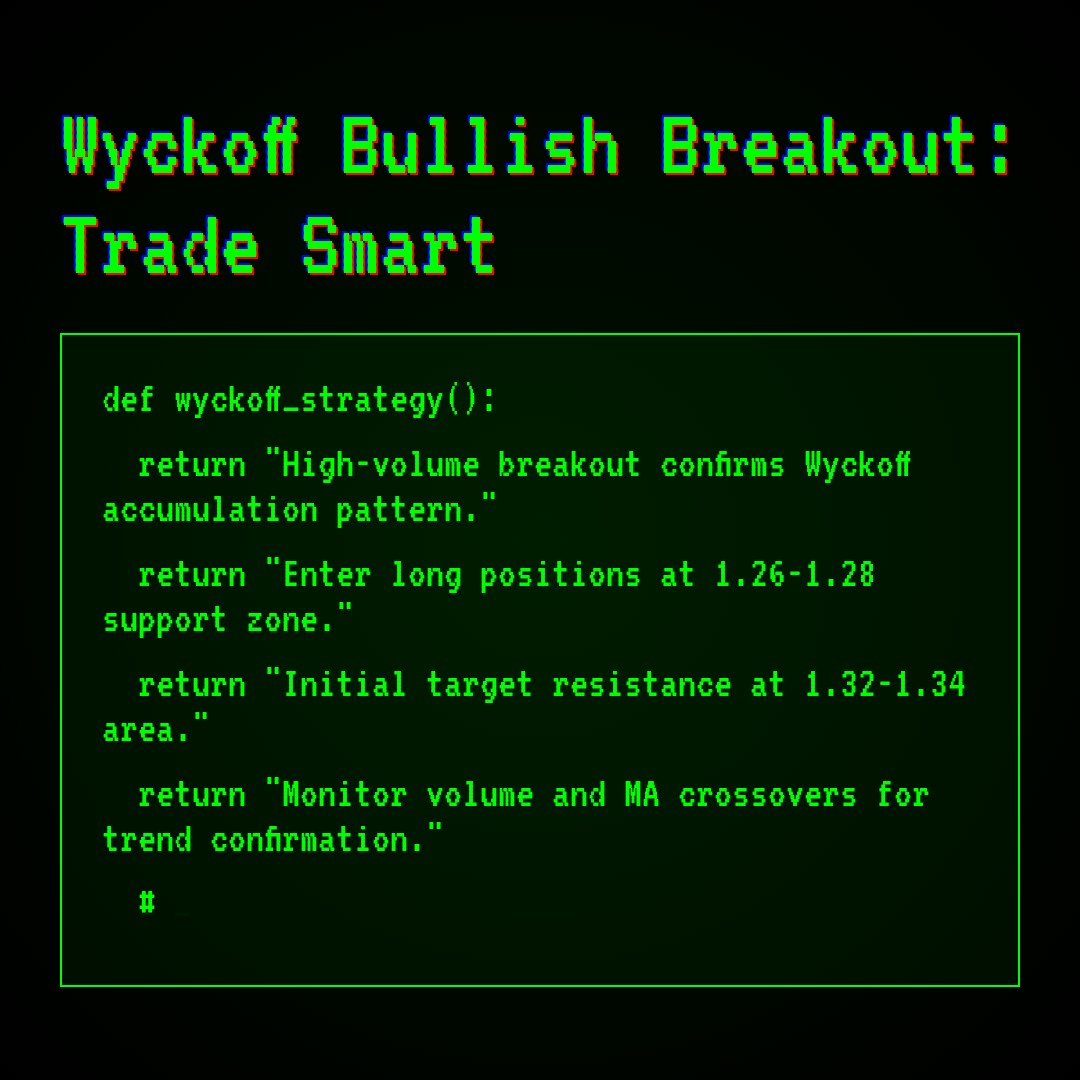
- • Primary Support Zone: 1.20 - 1.22. This is the solid bottom formed by the March Selling Climax (SC) and subsequent multiple tests, also the lower boundary of the accumulation range. The ultimate line of defense for any long position.
- • Immediate Support / Breakout Level: 1.26 - 1.28. This is the upper boundary of the early April consolidation range and the location of the MA_20D. After a breakout, it should convert into the first support.
- • Initial Resistance Zone: 1.32 - 1.34. Corresponds to the rebound high area in mid-March and the MA_30D.
- • Key Resistance Level: 1.45 - 1.48. Corresponds to the rebound high in mid-February, also a distribution area during the previous decline.
Synthesized Wyckoff Events & Trading Signals:
- 1. Signal Nature: Bullish. The market presents a complete Wyckoff accumulation structure, culminating in a high-volume breakout "Jump across the Creek" or SOS signal on Apr 10.
- 2. Operational Suggestions:
- • Entry Zone: Consider establishing long positions in batches if the price retraces to the 1.26-1.28 support zone.
- • Aggressive Entry: If the price sustains above 1.30 with continued volume expansion (
VOLUME_AVG_7D_RATIO > 1.2), it can be considered a trend-strengthening signal. - • Stop-Loss Placement: Should be set below the lower boundary of the accumulation range at 1.20 (e.g., 1.195). If the price falls back into this range and breaks below it on high volume, the accumulation thesis is invalidated.
- • Initial Target: Look towards the 1.32-1.34 resistance zone.
- 3. Future Verification Points:
- • Confirmation Signal (Required): A subsequent Last Point of Support (LPS) pullback is needed, i.e., a low-volume retest of support (e.g., 1.28) after the rise, followed by another high-volume advance, to confirm the establishment of a new uptrend.
- • Failure Signal (Should Not Occur): The price fails to maintain above the 1.26-1.28 support and breaks below 1.20 accompanied by expanding volume. This would negate the premise of successful accumulation, potentially leading to more prolonged basing or continued decline.
- • Monitoring Indicators: Closely observe whether volume can expand moderately during advances and contract significantly during pullbacks. Simultaneously, watch if short-term MAs (MA_5D, MA_10D) can form a golden cross and move above longer-term MAs.
Disclaimer: All conclusions in this report are derived from the provided historical data and quantitative models and do not constitute any investment advice. Financial markets carry risks; please make decisions cautiously.
Thank you for your attention! Wyckoff price-volume market analysis is released daily before the 8:00 AM market open. We kindly request your comments and shares; your recognition is crucial. Let's work together to see the market signals clearly.
Member discussion: