As a quantitative trading researcher proficient in the Wyckoff Method, I will draft a comprehensive and in-depth quantitative analysis report for you based on the HSI data you provided.
HSI Hang Seng Index Quantitative Analysis Report (Based on the Wyckoff Method)
Product Code: HSI
Analysis Date Range: February 9, 2026 - April 10, 2026
Report Generation Time: April 10, 2026
I. Trend Analysis and Market Phase Identification
As of April 10, 2026, for the underlying HSI: Opening Price 25891.88, Closing Price 25893.54, MA_5D 25368.82, MA_10D 25180.29, MA_20D 25386.61, Daily Change 0.55%, Weekly Change 3.09%, Monthly Change 4.46%, Quarterly Change 4.46%, Year-to-Date Change 1.03%.

- 1. Moving Average Alignment and Trend Judgment:
- • As of April 10, 2026, the closing price (25,893.54) is below all key moving averages: MA_5D (25,368.82) > MA_10D (25,180.29) > MA_20D (25,386.61) > MA_30D (25,588.81) > MA_60D (26,225.70). This forms a typical bearish alignment, indicating a clearly defined medium-term downtrend.
- • Key Signal: The price began to rebound after the late March low (low of 24,203.54 on March 23) and is currently attempting to test the resistance from the short-term MAs, MA_5D and MA_10D. The high-volume bullish candle on April 8 (Volume Ratio 1.34) was the first attempt, but the subsequent two days saw shrinking volume, indicating limited upward momentum and suggesting challenges for the rebound.
- 2. Market Phase Identification (Wyckoff Perspective):
- • Previous Phase (Late February to Late March): The price fell continuously from the high on February 23 (27,156.28) to the low on March 23 (24,203.54), accompanied by multiple high-volume decline days (e.g., March 2, March 4, March 9), aligning with the characteristics of Wyckoff's "decline after distribution" and "panic selling" phases.
- • Current Phase (Late March to Present): The price rebounded after hitting a new low. From March 23 to March 25, the price exhibited "high-volume deceleration of decline" at low levels (despite being bearish candles, volume was huge and the decline narrowed), followed by a rebound. Combined with volume analysis, the market may be transitioning from the "Panic" phase into the "Automatic Rally" or "Secondary Test" phase to confirm whether supply at the bottom has been exhausted. These are initial signs of a potential "accumulation" range.
II. Volume-Price Relationship and Supply-Demand Dynamics
As of April 10, 2026, for the underlying HSI: Opening Price 25891.88, Closing Price 25893.54, Volume 246316510217, Daily Change 0.55%, Volume 246316510217, 7-Day Average Volume 279534019059.14, 7-Day Volume Ratio 0.88.

- 1. Key Day Analysis:
- • Selling Climax: March 23, 2026, the price plummeted (-3.54%) with volume surging to 368.7 billion, and the
VOLUME_AVG_60D_RATIOreached a high of 1.41. This is a typical panic selling day, often indicating concentrated selling pressure from the public. - • Signs of High-Volume Deceleration/Accumulation: March 24, 2026, the price rebounded (+2.79%) with volume remaining high (303.1 billion,
VOLUME_AVG_60D_RATIO1.15). The critical point is that the next day (March 25), the price continued to rise (+1.09%) with volume further expanding to 351.0 billion (VOLUME_AVG_60D_RATIO1.32). This combination of "high-volume advance" at low levels is a strong signal of large institutional capital ("smart money") actively absorbing supply after the panic selling, consistent with Wyckoff's "accumulation" behavior. - • Demand Rally Test: April 8, 2026, the price rose significantly (+3.09%) with volume exploding to 372.4 billion (
VOLUME_AVG_60D_RATIO1.34), making it a recent demand-dominated day. This confirms the initiation of the rebound. However, in the following two days (April 9, 10), the price advance weakened and volume shrank significantly (VOLUME_AVG_7D_RATIOfell below 0.88), indicating short-term exhaustion of demand after encountering resistance. New demand is needed for the rebound to continue.
- • Selling Climax: March 23, 2026, the price plummeted (-3.54%) with volume surging to 368.7 billion, and the
- 2. Volume Anomalies and Supply-Demand Shift:
- • Historical Extreme Volume Confirmation: Historical ranking data confirms the extremity of March activity. The
WEEK_MAX_VOLUME(392.3 billion, March 9) ranks as the 17th highest in the past decade, and theWEEK_MAX_AVERAGE_VOLUME_7D(347.2 billion, March 11) ranks as the 20th highest in the past decade. This statistically confirms that trading activity in mid-to-late March reached historically rare levels, significantly increasing the probability that this area constitutes an important turning point (bottom). - • Interpretation of Supply and Demand Forces: In the low area of late March, massive volume (panic selling + high-volume deceleration) indicates large-scale absorption of supply. The subsequent rebound in early April, particularly the high-volume advance on April 8, shows that demand is beginning to attempt to dominate the market. The current pullback and consolidation accompanied by low volume is a key window to observe whether supply is re-emerging.
- • Historical Extreme Volume Confirmation: Historical ranking data confirms the extremity of March activity. The
III. Volatility and Market Sentiment
As of April 10, 2026, for the underlying HSI: Opening Price 25891.88, 7-Day Parkinson Volatility 0.14, 7-Day Parkinson Volatility Ratio 0.81, 7-Day Historical Volatility 0.28, 7-Day Historical Volatility Ratio 0.79, RSI 53.84.

- 1. Volatility Analysis:
- • Panic Peak: Short-term volatility spiked significantly around the late March low.
HIS_VOLA_7Dreached a high of 0.41 on March 24, withHIS_VOLA_RATIO_7D_60Das high as 1.58, indicating short-term panic far exceeding long-term normal levels.PARKINSON_VOL_7Dalso expanded synchronously, confirming intense intraday price swings. - • Sentiment Stabilization: In April, volatility metrics have converged across the board. As of April 10,
HIS_VOLA_7Dhas fallen to 0.28,PARKINSON_VOL_7Dto 0.14, andHIS_VOLA_RATIO_7D_60Dhas retreated to 1.06. This indicates the market is recovering from extreme panic, with sentiment stabilizing, providing an environment for a potential trend change.
- • Panic Peak: Short-term volatility spiked significantly around the late March low.
- 2. Overbought/Oversold Status (RSI Confirmation):
- • At the price low on March 23,
RSI_14fell to 32.34, entering oversold territory, consistent with the "panic selling" conclusion. - • The current
RSI_14is 53.84, in the neutral zone, indicating neither overbought nor oversold pressure, leaving room for the price's next directional move.
- • At the price low on March 23,
IV. Relative Strength and Momentum Performance
- 1. Momentum Trend:
- • Short-Term Momentum Turns Positive: Both
WTD_RETURN(3.09%) andMTD_RETURN(4.46%) are positive, indicating strong short-term momentum, consistent with the price rebound from the late March low. - • Medium-to-Long-Term Momentum Remains Weak: Although
QTD_RETURN(4.46%) andYTD(1.03%) have turned positive, their absolute values are not high. Furthermore, theYTDreturn is significantly lower thanQTD, indicating severe damage to long-term momentum from the deep decline in Q1 (especially Feb-Mar). The market still needs time to recover.
- • Short-Term Momentum Turns Positive: Both
- 2. Comprehensive Interpretation: Momentum indicators show the market is in the process of a short-term oversold rebound repair, but a solid medium-to-long-term uptrend has not yet been established. The sustainability of the rebound requires further confirmation from subsequent volume-price action.
V. Large Investor ("Smart Money") Behavior Identification
Based on the above volume-price, volatility, and phase analysis, the inferred behavior of large investors is as follows:
- 1. Accumulation Behavior Confirmation: During the period from March 23 to March 25, the market experienced "high-volume deceleration of decline" and "high-volume advance" following "panic selling." Massive volume occurring at low price levels is typical "smart money" accumulation behavior. They utilized public panic to absorb a large amount of supply at low prices. Historical ranking data corroborates the abnormal activity during this period.
- 2. Current Behavior: Rally Test and Shakeout?
- • The high-volume advance on April 8 represents smart money driving demand to test supply above.
- • The low-volume, minor consolidation on April 9-10 can be interpreted as smart money pausing purchases to observe market reaction after the initial rally, and possibly inducing a minor pullback for a "shakeout" to flush out weak, short-term holders who followed the rebound.
- 3. Intent Inference: The core intent of large investors is to build a medium-term bottom (accumulation range) below the 25,000 point level. The market is currently in the early stages of confirming the validity of this bottom. Their goal is to push the price above key resistance levels to complete accumulation and initiate a new uptrend.
VI. Support/Resistance Level Analysis and Trading Signals

- 1. Key Levels:
- • Primary Support:
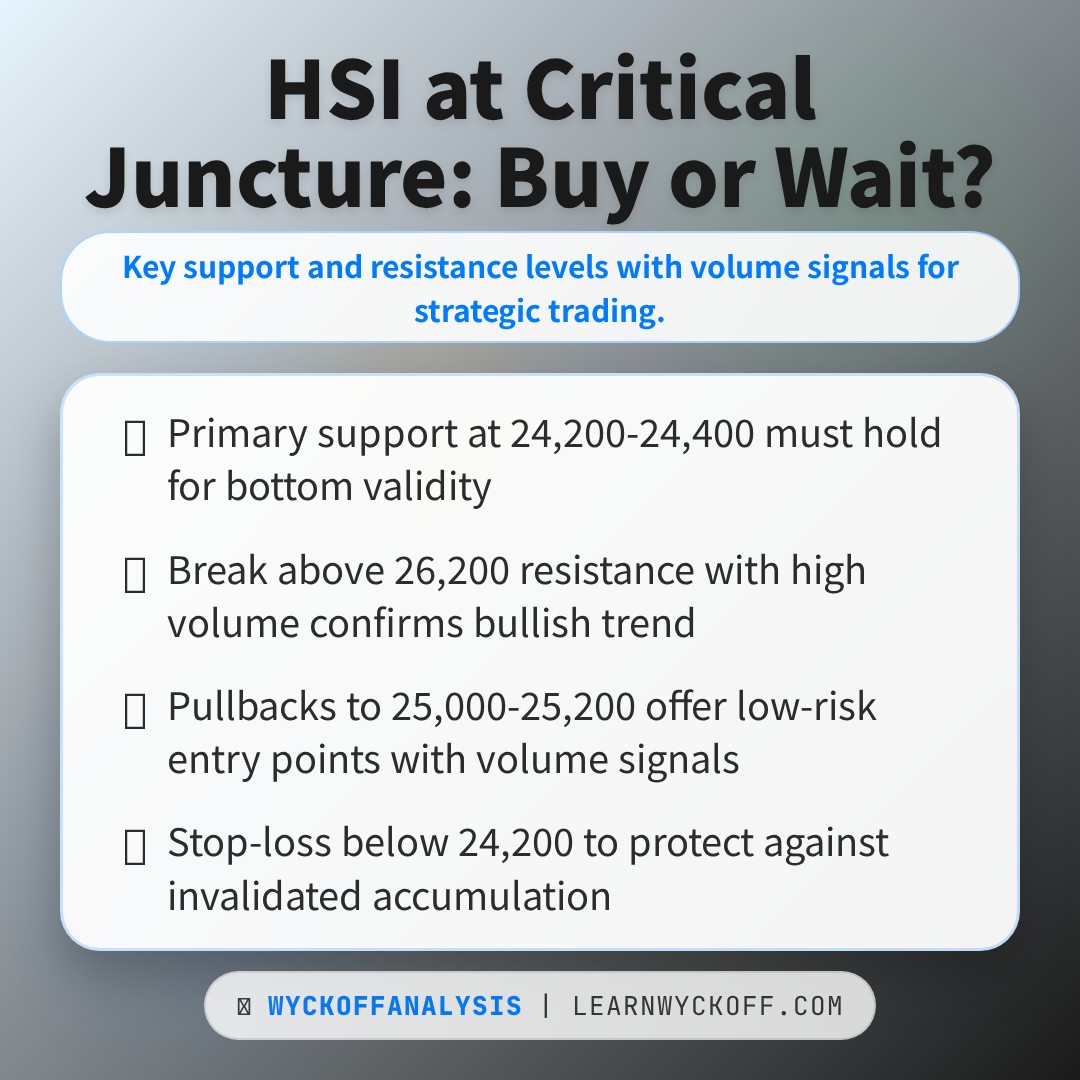
- • S1 (Absolute Support/Panic Low): 24,200 - 24,400 zone (March 23-24 lows). This zone experienced historically significant volume and is the lower boundary of the accumulation range; it must hold.
- • S2 (Recent Rebound Starting Point/Secondary Test Level): 25,000 - 25,200 zone (March 30-31 lows). If the price retraces, it should find support with shrinking volume in this zone.
- • Primary Resistance:
- • R1 (Initial Supply Zone/Moving Average Resistance): 25,900 - 26,200 zone (near current price, convergence area of MA_20D/MA_30D/MA_60D). Breaking through this zone requires significant volume expansion.
- • R2 (Previous Decline Starting Point/Upper Boundary of Distribution Area): 27,000 - 27,200 zone (Late February highs).
- • Primary Support:
- 2. Comprehensive Trading Signals and Operational Recommendations:
- • Overall Judgment: Cautiously bullish, but in a critical verification period. Market structure shows large capital actively accumulating at lows, but bottom formation is not yet complete, and the rebound faces its first major resistance test.
- • Operational Recommendations:
- • Aggressive Strategy (Buy on Pullback): Wait for the price to retrace to the S2 (25,000-25,200) support zone and show signs of low-volume stabilization (e.g., small-body candlesticks,
VOLUME_AVG_7D_RATIO< 0.8). Consider light long positioning in this area. - • Conservative Strategy (Follow the Breakout): Wait for the price to break above R1 (26,200, especially MA_60D) with high volume (
VOLUME_AVG_7D_RATIO> 1.2), confirming demand has overcome medium-term moving average resistance, then follow with a right-side entry.
- • Aggressive Strategy (Buy on Pullback): Wait for the price to retrace to the S2 (25,000-25,200) support zone and show signs of low-volume stabilization (e.g., small-body candlesticks,
- • Stop-Loss Placement: The final stop-loss for any long position should be set below S1 (24,200). A high-volume break below this level invalidates the bottom accumulation hypothesis.
- • Future Validation Points:
- 1. (Bullish Validation) After finding support anywhere above S2 or S1, any subsequent price advance must be accompanied by expanding volume to prove sustained demand.
- 2. (Bearish Validation/Risk Warning) If, upon rallying to the R1 zone, the price shows signs of high-volume stagnation or long upper shadows, it indicates supply remains strong, and the rebound may be ending; consider reducing exposure. If the price breaks below 25,000 with expanding volume, the rebound structure is compromised, and a shift to a neutral stance is warranted.
Conclusion: After experiencing a wave of panic-driven decline, HSI has shown clear signs of smart money accumulation. The market is currently in the critical "Automatic Rally" and "Secondary Test" phases of constructing a medium-term bottom. Traders should remain patient, closely monitor the battle between the 25,000-point support and the 26,200-point resistance, and base operations on specific volume-price validation signals rather than subjective directional predictions.
Disclaimer: This report/analysis content is solely market analysis and research based on public information and does not constitute any investment advice or operational guidance. The author strives for objectivity and fairness but makes no guarantees regarding accuracy or completeness. Markets involve risks, and investments require caution. Any investment actions based on this report are taken at one's own risk.
Thank you for your attention! Wyckoff Volume-Price Market Interpretation is released daily at 8:00 AM before market open. Comments and shares are appreciated; your recognition is crucial. Let's work together to see the market signals clearly.
Member discussion: