Okay, following your instructions. As a quantitative trading researcher proficient in the Wyckoff Method, I will author a comprehensive, in-depth quantitative analysis report based on the BOTZ data and historical rankings you provided.
Quantitative Analysis Report on BOTZ Based on Wyckoff Volume-Price Theory
Product Code: BOTZ
Analysis Date Range: 2026-02-09 to 2026-04-10
Report Generation Date: 2026-04-11
1. Trend Analysis and Market Phase Identification
As of April 10, 2026, the underlying asset BOTZ has an open price of 35.51, a close price of 35.43, a 5-day moving average of 34.08, a 10-day moving average of 33.53, a 20-day moving average of 34.11, a daily change of 1.46%, a weekly change of 6.08%, a monthly change of 6.65%, a quarterly change of 6.65%, and a yearly change of -2.21%.

- • Moving Average Alignment Analysis:
- • Phase I (Feb 9 - Feb 27): The price (CLOSE) traded consistently above all major moving averages (MA_5/10/20/30/60) for most of the period. Specifically, MA_5, MA_10, and MA_20 formed a clear bullish alignment (short-term > medium-term > long-term), signaling a distinct uptrend. The price reached a cycle high of 39.66 on February 25.
- • Phase II (Mar 2 - Mar 27): A market reversal occurred. On March 2, the price broke below the MA_20 and MA_30 with high volume, indicating a weakening medium-term trend. Subsequently, the price continued its decline. By late March, the MA_5 crossed below the MA_10, MA_20, and MA_30, forming a bearish alignment. The price moved significantly away from all moving averages, confirming entry into a downtrend.
- • Phase III (Mar 30 - Apr 10): The price rebounded from the low of 31.99 (March 30). Currently (April 10), the price (35.43) has successfully reclaimed the MA_5 (34.084) and MA_10 (33.528) and is testing the MA_20 (34.112). However, the MA_20, MA_30, and MA_60 still exhibit a bearish alignment, indicating that repair of the long-term downtrend has just begun. The market is in a transitional phase from decline to a potential basing/rebound stage.
- • Market Phase Inference (Based on Wyckoff Theory):
- • Late February (Distribution Phase): After reaching a multi-year high (historical ranking shows the closing price on Feb 25 ranked 4th), the price exhibited consolidation at high levels (e.g., Feb 23-27) with sustained active volume. This aligns with the characteristics of the Wyckoff Distribution phase: large investors transferring holdings to the public buyers amidst optimism.
- • March (Panic/Decline Phase): The price began a sharp plunge with consecutive high-volume long bearish candles (e.g., Mar 2, 3), breaking below key support levels. This is a typical Panic Selling (PSY) phase. Historical ranking data confirms the extremity of this event (Weekly Max Volume rank 17, Turnover rank 5).
- • Late March to Early April (Potential Secondary Test and Automatic Rally Phase): After hitting a low of 32.46 on March 27, the price rebounded with high-volume bullish candles (March 31, April 8). The high-volume, strong bullish candle on April 8 (+5.18%) is particularly crucial and can be viewed as the Automatic Rally (AR), indicating the initial entry of demand. The subsequent pullback (April 9) occurred on lower volume, consistent with the characteristics of a Secondary Test (ST) – testing the validity of the low support. The current (April 10) price advance with a moderate increase in volume suggests the Secondary Test may have been successful.
2. Volume-Price Relationship and Supply-Demand Dynamics
As of April 10, 2026, the underlying asset BOTZ has an open price of 35.51, a close price of 35.43, a volume of 573,378, a daily change of 1.46%, a volume of 573,378, a 7-day average volume of 761,492.57, and a 7-day volume ratio of 0.75.

- • Key Day Analysis:
- • Supply-Dominated Days (Supply Overwhelms Demand):
- • 2026-03-03: Textbook Panic Selling Day. Price plummeted -3.38% on a massive volume surge of 139.31%, reaching 3.335 million shares, the highest in the cycle. The
VOLUME_AVG_14D_RATIOwas as high as 3.59 (historical rank 17). The extreme volume on a sharp decline clearly indicates overwhelming excess supply (selling pressure), plunging the market into panic. - • 2026-03-20: Downtrend Acceleration Day. Price fell -3.67% on a volume of 1.154 million shares, significantly above the recent average (
VOLUME_AVG_30D_RATIO=1.18). A high-volume decline shows supply continues to dominate, reinforcing the downtrend.
- • 2026-03-03: Textbook Panic Selling Day. Price plummeted -3.38% on a massive volume surge of 139.31%, reaching 3.335 million shares, the highest in the cycle. The
- • Demand-Dominated Days (Demand Overwhelms Supply):
- • 2026-04-08: Key Demand Recovery Day. Price surged +5.18% on a volume of 1.146 million shares, 1.37 times the recent average (
VOLUME_AVG_7D_RATIO). The high-volume breakout advance indicates strong, active demand (buying pressure) entering the market, altering the previous downtrend structure. This is the first crucial signal of a potential trend change. - • 2026-03-31: Preliminary Downturn Arrest Day. Following continuous declines, the price rebounded +3.84% on a volume of 1.057 million shares (
VOLUME_AVG_14D_RATIO=1.18). The high-volume rebound shows that after a deep decline, capital began attempting absorption, with demand demonstrating organized strength at lower price levels for the first time.
- • 2026-04-08: Key Demand Recovery Day. Price surged +5.18% on a volume of 1.146 million shares, 1.37 times the recent average (
- • Supply Exhaustion/Demand Hesitation Days:
- • 2026-03-10, 03-11: After the sharp fall, the price fluctuated slightly at low levels. Volume shrank significantly to 634k and 552k shares respectively, well below average levels (both
VOLUME_AVG_60D_RATIO< 0.7). Consecutive low-volume, narrow-range consolidations indicate that after the sharp drop, supply (selling pressure) temporarily dried up, but demand remained hesitant, leading the market into a brief equilibrium.
- • 2026-03-10, 03-11: After the sharp fall, the price fluctuated slightly at low levels. Volume shrank significantly to 634k and 552k shares respectively, well below average levels (both
- • Supply-Dominated Days (Supply Overwhelms Demand):
- • Supply-Demand Dynamic Shift: The data clearly illustrates the transition of forces: the demand dominance at February highs shifted to supply dominance → absolute supply dominance in early-mid March triggered panic → signs of supply exhaustion emerged in late March → organized demand counterattacks began from late March to early April, achieving preliminary results (high-volume bullish candle on April 8).
3. Volatility and Market Sentiment
As of April 10, 2026, the underlying asset BOTZ has an open price of 35.51, a 7-day intraday volatility of 0.19, a 7-day intraday volatility ratio of 0.90, a 7-day historical volatility of 0.42, a 7-day historical volatility ratio of 0.92, and an RSI of 53.98.

- • Volatility Analysis:
- • Panic Period Characteristics: During the sharp decline in early March, short-term volatility spiked dramatically. For example, on March 3,
HIS_VOLA_7Djumped to 0.339, andHIS_VOLA_RATIO_7D_14Dreached 1.29, indicating that short-term volatility far exceeded medium-term volatility—a typical signal of panic and trend acceleration. - • Volatility Convergence: Entering April, the ratio of
HIS_VOLA_7D(0.420) to longer-term volatilities (e.g.,HIS_VOLA_30D: 0.392), measured byHIS_VOLA_RATIO_7D_30D, dropped to 1.07, andPARKINSON_RATIO_7D_30Dfell to 0.82. The convergence of volatility from extreme highs suggests market sentiment is gradually stabilizing from panic, entering a new equilibrium or basing phase.
- • Panic Period Characteristics: During the sharp decline in early March, short-term volatility spiked dramatically. For example, on March 3,
- • RSI Sentiment Indicator:
- • Overbought and Oversold: The RSI_14 reached 64.69 on February 25, nearing the overbought zone (>70), resonating with the price top. It subsequently fell to a deeply oversold level of 26.38 on March 27, confirming extreme market pessimism.
- • Current State: The current RSI_14 is 53.98, having rebounded strongly from the oversold zone to a neutral-to-strong area. This positive divergence with the price rebound indicates a significant recovery in market sentiment.
4. Relative Strength and Momentum Performance
- • Return Analysis:
- • Momentum Reversal: The
MTD_RETURNdeteriorated sharply from +6.27% (Feb 25) at the end of February to -18.02% (Mar 30) by the end of March, showing a devastating reversal in medium-term momentum. - • Momentum Repair: Momentum indicators have improved markedly in April. The
MTD_RETURNhas recovered from -11.70% (Mar 30) to +6.65% (Apr 10), and theWTD_RETURNis +6.08%, indicating very strong short-term momentum. However, theYTDremains at -2.21%, indicating that the overall weak pattern since the beginning of the year has not been completely reversed.
- • Momentum Reversal: The
- • Conclusion: Short-term momentum (weekly, April-to-date) has strengthened significantly, but medium-term momentum (quarterly, yearly) remains weighed down by the March plunge. The momentum structure aligns with the price action and volume-price analysis: The market is currently in a strong short-term rebound aimed at repairing the severely damaged medium-term trend.
5. Smart Money Behavior Identification
- • Late February Distribution: Price consolidated within the historical high range (closing price ranks 4-10) with active volume but failed to make significant new highs. This aligns with the behavior pattern of smart money distributing holdings to the market at high levels.
- • Absorption During Early March Panic: The extreme-volume plunge on March 3 (Turnover historical rank 5) is a classic phenomenon. While superficially a panic sell-off, such massive turnover ($122 million) implies an equivalent amount of buying. Wyckoff theory posits that bottoms of Panic Selling (PSY) phases are often accompanied by active absorption by "professionals." The historically high turnover rank strongly suggests that large institutions engaged in substantial accumulation at these extreme price levels.
- • Re-accumulation in April: The high-volume bullish candle on April 8 is another key signal of smart money behavior. After experiencing panic, testing, and low-volume consolidation, breaking the downtrend structure with a high-volume advance is typically a sign of institutional capital re-entering to establish positions, not retail chasing. The subsequent low-volume pullback (April 9) and moderate-volume advance (April 10) further validate the stability of demand.
6. Support/Resistance Level Analysis and Trading Signals

- • Key Price Level Identification:
- • Strong Resistance Zone: 37.80 - 38.60. This area represents the lower boundary of the late February consolidation platform, the starting point of the early March plunge, and the current location of the MA_30 and MA_60, constituting multiple layers of resistance.
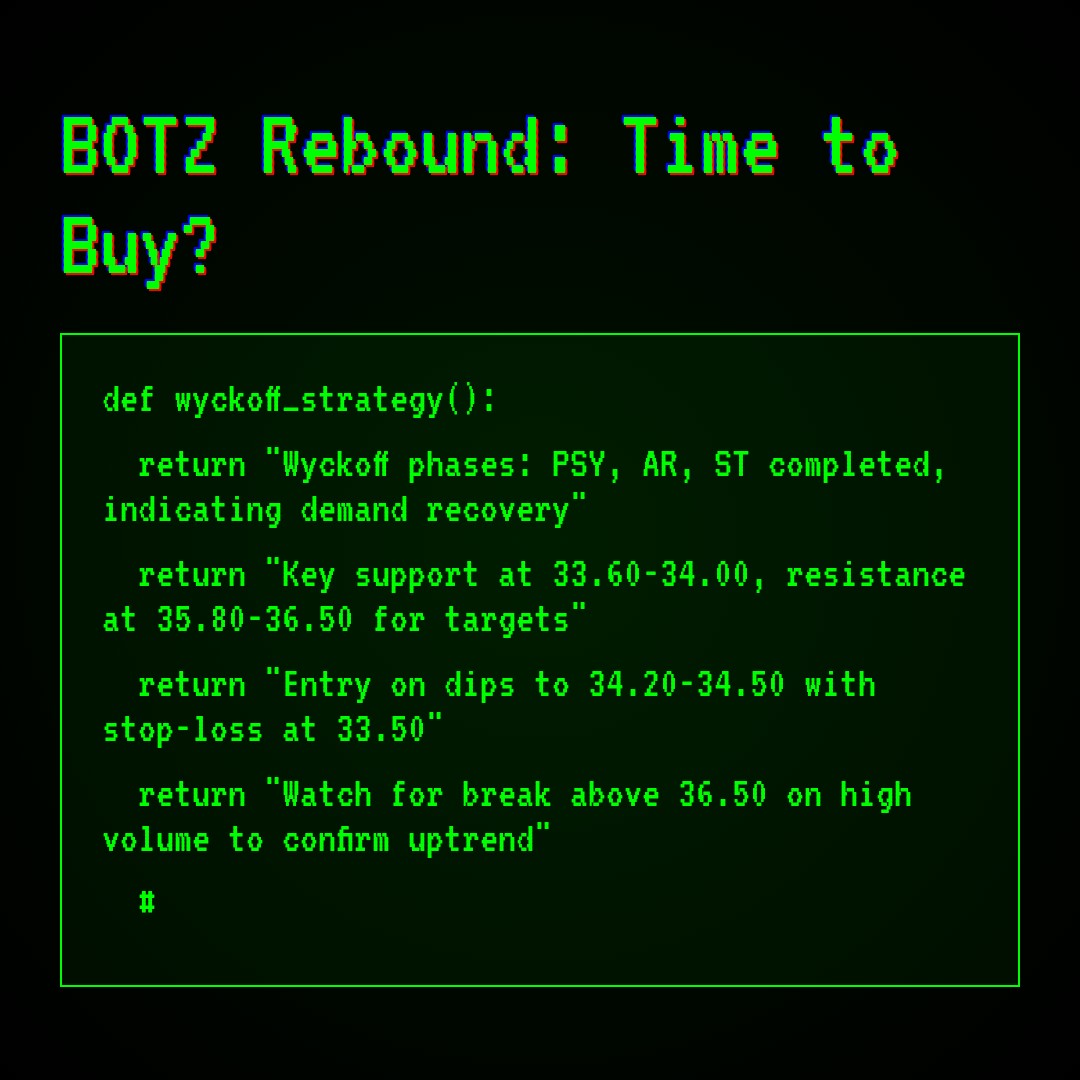
- • Initial Resistance / Current Target: 35.80 - 36.50. The high of April 8 and the low range of the mid-March consolidation platform.
- • Key Support / Secondary Test Low: 33.60 - 34.00. Corresponds to the launch point of the April 8 bullish candle and the vicinity of the MA_20.
- • Strong Support Level: 31.99. The absolute low of this decline (March 30), which must hold to prevent further trend deterioration.
- • Historical High Resistance: According to historical rankings, the 39.50-39.80 zone is a top-tier resistance area over the past decade.
- • Comprehensive Trading Signals and Operational Recommendations:
- • Overall Assessment: The market has completed the Panic Selling (PSY) and Automatic Rally (AR) phases and is currently potentially in the stage following a successful Secondary Test (ST), entering a new potential Accumulation phase or the early stage of an uptrend. The short-term view has shifted from bearish to cautiously bullish/rebound.
- • Operational Recommendations:
- 1. Already Positioned (Based on April 8 signal): The stop-loss can be set below the Secondary Test low at 33.60.
- 2. Seeking Entry: Consider entering in tranches upon a pullback to 34.20-34.50 (near MA_20 and prior support) with signs of low-volume stabilization. Set the stop-loss at 33.50.
- 3. Target Levels: First target 36.00-36.50 (prior platform resistance), second target 37.80 (upper edge of the strong resistance zone).
- 4. Confirmation Point for Adding: If the price breaks through and sustains above 36.50 on high volume, it can be seen as a signal that the rebound is upgrading. Re-evaluate opportunities to add to the position at that time, with the target shifting to 37.80.
- • Risk Warnings and Future Validation Points:
- • Primary Risk: If the price breaks below 33.60 on high volume, the Secondary Test fails, indicating insufficient demand to reverse the trend. The rebound thesis would be invalidated, and positions should be exited for observation.
- • Trend Confirmation Point: The price needs sustained high volume to overcome the strong resistance zone at 37.80-38.60. Achieving this would confirm the start of a larger-degree uptrend.
- • Warning Signal: If the price advances into resistance zones (e.g., 36.50 or 37.80) and shows high-volume stagnation or long upper shadows, it signals the re-emergence of supply. Consider reducing or closing positions.
Report Summary: Based on Wyckoff volume-price analysis, BOTZ has shown clear signs of smart money accumulation and demand recovery in late March and early April, following the Distribution phase in late February and the Panic Sell-off in March. The current market structure suggests a sustainable rebound or trend reversal is brewing. The key validation point lies in whether demand can persistently overcome the layers of resistance above. A strategy of entering on dips is recommended, with strict stop-losses to manage potential risks.
Disclaimer: This report/analysis is solely for market analysis and research based on public information and does not constitute any investment advice or operational guidance. The author strives for objectivity and fairness but makes no guarantees regarding accuracy or completeness. Markets involve risks, and investment requires caution. Any investment actions based on this report are taken at one's own risk.
Thank you for your attention! Daily Wyckoff Volume-Price market interpretation is published promptly at 8:00 AM before the market opens. Your comments and shares are greatly appreciated. Your recognition is paramount. Let's work together to see the market signals clearly.
Member discussion: