Okay, complying with your instructions. As a quantitative trading researcher proficient in the Wyckoff Method, I will write an in-depth quantitative analysis report for product 513060 based on the data you provided.
Wyckoff Volume-Price Quantitative Analysis Report
Product Code: 513060
Analysis Date Range: 2026-02-09 to 2026-04-10
Report Generation Date: 2026-04-10
1. Trend Analysis and Market Phase Identification
As of April 10, 2026, for the target 513060: Opening Price 0.60, Closing Price 0.60, 5-day MA 0.60, 10-day MA 0.59, 20-day MA 0.58, Daily Change 0.17%, Weekly Change 0.00%, Monthly Change 4.54%, Quarterly Change 4.54%, Annual Change 2.74%.

- • Moving Average Alignment and Trend Structure:
- • Initial Phase (Feb 9 - Feb 11): The price (CLOSE) rose from 0.630 to 0.645, staying above the MA_5D and MA_10D, but below the MA_20D (0.6394) and longer-term MAs. The market was in a stage of short-term rebound, yet suppressed by the mid-term moving average resistance.
- • Downtrend Phase (Feb 12 - Mar 23): The price began a sustained decline, reaching a low of 0.532 on March 23. During this period, the price successively broke below all short-, medium-, and long-term moving averages, forming a standard bearish alignment (Price < MA_5D < MA_10D < MA_20D < MA_30D < MA_60D), signifying a clear intermediate-term downtrend.
- • Trend Transition and Bottoming Phase (Mar 24 - Apr 10): Following the low of 0.532, the price initiated a rebound. By April 10, the price (0.599) had risen above the MA_5D (0.603) and MA_10D (0.590), approaching the MA_20D (0.577). MA_5D has crossed above MA_20D, forming a preliminary "Golden Cross" signal. The MA_20D, MA_30D, and MA_60D are still declining but their slopes are flattening. The market structure has shifted from a one-sided decline to consolidating a bottom while attempting to reverse the short-term trend.
- • Wyckoff Market Phase Inference:
- • 2026-02-26 to 2026-03-23: This phase aligns with the Wyckoff characteristics of Panic Selling and Automatic Rally. Prices declined sharply and consecutively (e.g., March 4: -4.66%), with volume expanding on some down days (e.g., March 4: VOLUME_AVG_60D_RATIO=1.72), indicating the release of panic sentiment. Subsequent rebounds (e.g., March 5, 6) lacked sustained high-volume support, qualifying as an "Automatic Rally."
- • 2026-03-24 to Present: The market has entered a potential Secondary Test and Accumulation phase. The strong bullish candlestick on March 24 with high volume (volume growth 38.8%) recovered most of the previous day's losses, showing strong demand entering. Subsequently, the price consolidated within the 0.55-0.61 range, undergoing multiple pullbacks without making new lows. Volume significantly contracted during these pullbacks (e.g., April 3, 7), indicating weakening supply and suggesting that large investors may be accumulating shares within this range.
2. Volume-Price Relationship and Supply-Demand Dynamics
As of April 10, 2026, for the target 513060: Opening Price 0.60, Closing Price 0.60, Volume 1188790900, Daily Change 0.17%, Volume 1188790900, 7-day Average Volume 1256849048.43, 7-day Volume Ratio 0.95.

- • Key Demand-Dominated Days (Demand Expansion):
- • 2026-03-24: Price increased 3.95%, volume surged 38.78% (VOLUME_GROWTH), and the Volume/14-day Average Volume Ratio (VOLUME_AVG_14D_RATIO) reached 1.39, with historical rankings in the high range. This is a classic Sign of Strength (SOS), indicating strong demand overcoming supply and serving as the first strong signal for a potential trend reversal.
- • 2026-04-01: Price increased 6.28%, volume grew 55.03%, and the Volume/60-day Average Volume Ratio was as high as 1.56. This is behavior at the buying climax level, with smart money entering aggressively, further confirming demand dominance. Historical ranking shows this day's gain was the 7th highest in nearly ten years, an extreme event.
- • 2026-04-08: Price increased slightly by 0.50%, but volume grew dramatically by 188.59% (16th highest historical rank), with a Volume/7-day Average Volume Ratio of 0.92. The occurrence of high-volume, narrow-range movement at a post-rally platform may indicate transfer between large investors and can be viewed as a test of demand for the prior rally, with supply being effectively absorbed.
- • Key Supply Exhaustion Days (Supply Contraction):
- • 2026-04-03 and 2026-04-07: These two trading days saw little price movement (-1.32% and +0.83%), but volume was extremely low. Their Volume/7-day Average Volume Ratios were 0.297 and 0.296, ranking 14th and 13th lowest respectively in the near-decade historical ranking. This is a typical Low Volume Pullback (LVP). In an uptrend or bottoming phase, a low-volume pullback indicates extremely limited selling pressure (supply) and market reluctance to sell, a healthy correction signal.
- • Panic Selling Days (Supply Expansion):
- • 2026-03-04 and 2026-03-23: Prices fell 2.65% and 4.66% respectively, with volume significantly expanded on both days (VOLUME_AVG_60D_RATIO 1.72 and 1.19 respectively). These exhibit characteristics of a Selling Climax (SC), where public investors capitulate in fear. However, the subsequent price action did not make new lows and was quickly lifted by demand, suggesting this selling was likely absorbed by large investors.
3. Volatility and Market Sentiment
As of April 10, 2026, for the target 513060: Opening Price 0.60, 7-day Intraday Parkinson Volatility 0.31, 7-day Intraday Volatility Volume Ratio 0.90, 7-day Historical Volatility 0.49, 7-day Historical Volatility Volume Ratio 0.93, RSI 54.15.

- • Volatility Level and Changes:
- • Panic Period (Early March): Short-term volatility (HIS_VOLA_7D) was significantly higher than long-term volatility (HIS_VOLA_60D). For instance, on March 6, HIS_VOLA_RATIO_7D_60D reached 1.56, indicating tense market sentiment and abnormally amplified volatility.
- • Bottoming Period (Late March to Present): The volatility ratio has gradually converged. As of April 10, HIS_VOLA_RATIO_7D_60D is 1.24, still above 1 but down from its peak. Simultaneously, the 7-day Parkinson Intraday Volatility (PARKINSON_VOL_7D) dropped to 0.307, a relatively low recent level. This suggests market sentiment is stabilizing from panic, with volatility convergence being a typical environment for trend development.
- • Overbought/Oversold Status (RSI):
- • Sentiment Low Point: RSI_14 touched 23.58 on March 4, an extreme oversold zone, ranking 8th lowest in the near-decade history, confirming the extreme pessimism of market sentiment at that time, resonating with the panic price decline.
- • Sentiment Recovery: The current RSI_14 is 54.15, having recovered from the oversold zone to a neutral-strong area, indicating market sentiment has rebounded from the crash, providing an emotional foundation for further price upside.
4. Relative Strength and Momentum Performance
- • Return Momentum Analysis:
- • Short-term Momentum (WTD/MTD): Weekly return (WTD_RETURN) oscillated near 0%, while monthly return (MTD_RETURN) is +4.54%. This shows that short-term downward momentum exhausted by late March and has turned positive.
- • Mid-term Momentum (QTD/YTD): Quarterly return (QTD_RETURN) and Year-to-Date return (YTD) are both positive (+4.54% and +2.74%), indicating that from an intermediate-term perspective, after a deep correction, the product's annual return has successfully turned positive, and mid-term momentum is beginning to turn positive.
- • Conclusion: Momentum indicators align with price trend analysis, confirming the market's transition from declining momentum to repair and upward momentum.
5. Large Investor (Smart Money) Behavior Identification
Integrating the above dimensions allows for a clear inference of large investor intentions:
- 1. Active Accumulation in the Bottom Zone: During the panic decline in mid-late March (e.g., March 23) and secondary tests (e.g., March 24, April 1), clear demand signals of rising price on rising volume appeared. Historically high-ranking volume increases (e.g., April 8) indicate this is not retail activity but organized capital absorbing selling pressure at key levels, consistent with the Wyckoff "Accumulation" phase characteristic.
- 2. Locking in Shares and Shakeout: Following the early April rebound, extremely low-volume pullbacks occurred (April 3, 7). The historically extreme low volume ratios indicate a scarcity of floating supply; large investors did not distribute after the rally but locked in their shares. This may be a mild "Shakeout" to wash out weak longs.
- 3. Intent Summary: Smart money demonstrated strong accumulation intent in the 0.55-0.58 zone (corresponding to the March low and initial rebound area) and tested overhead supply through subsequent high-volume advances. Currently, they are in a holding and observing state, awaiting clearer signals from the market for an upward thrust or another test.
6. Support/Resistance Level Analysis and Trading Signals

- • Key Support Levels:
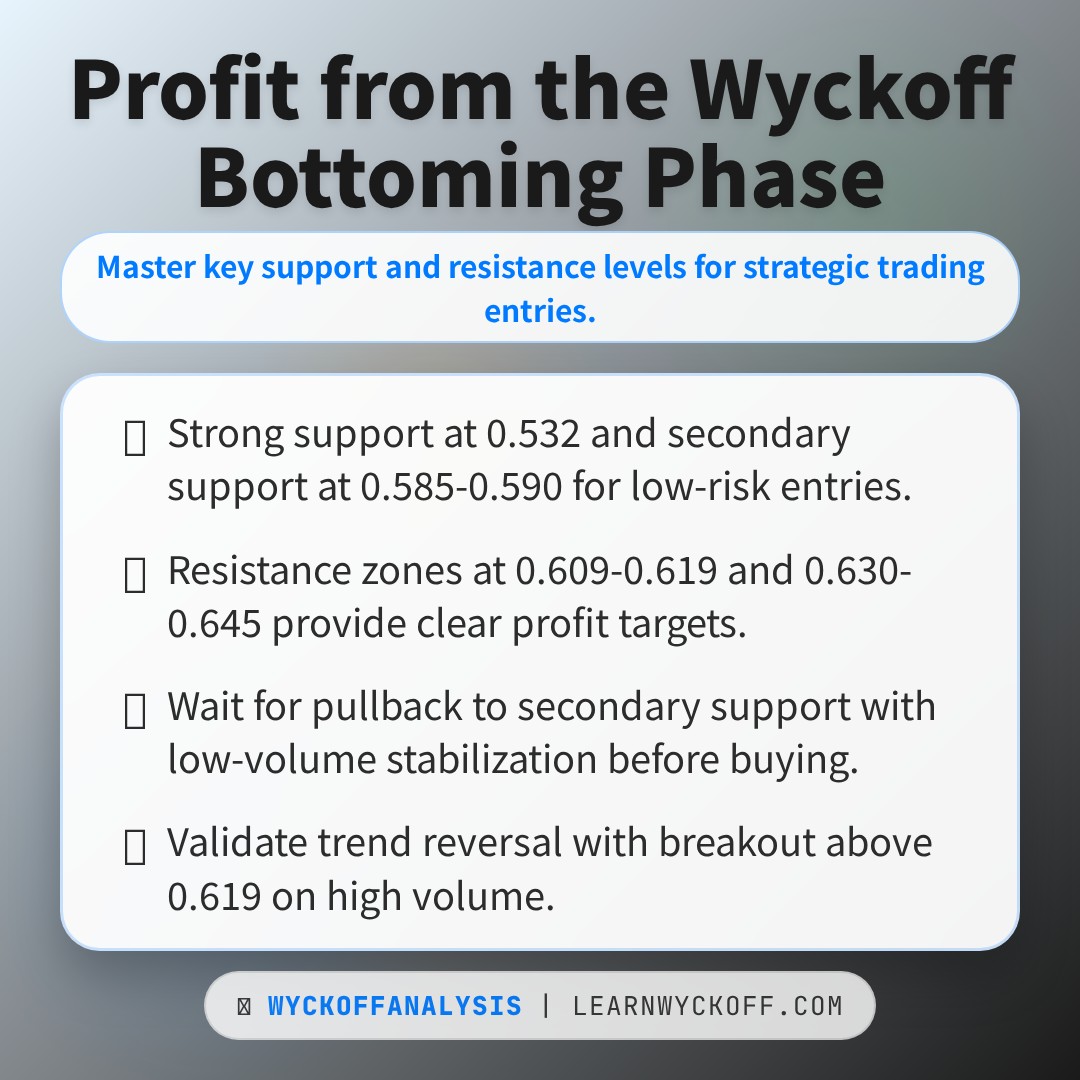
- • Primary Support (Strong): 0.532 (Low on 2026-03-23). This is the bottom formed by panic selling and the location where large-scale demand first intervened.
- • Secondary Support (Medium): 0.585 - 0.590 zone. This area is the launch platform for the early April rebound and the current location of MA_5D and MA_10D, constituting recent dynamic support.
- • Key Resistance Levels:
- • Near-term Resistance (Medium): 0.609 - 0.619 (High zone from 2026-04-01 to 02). This is the endpoint of the first wave of the post-rebound rally, containing short-term supply.
- • Primary Resistance (Strong): 0.630 - 0.645 (High from the February 2026 rebound and previous congestion zone). A successful breakout above this zone would be a confirmation signal for an intermediate-term trend reversal.
- • Comprehensive Wyckoff Trading Signals and Operational Suggestions:
- • Current Phase Judgment: The market is in the later stage of the Accumulation/Bottoming phase following the termination of the downtrend, attempting to initiate an upward move (Markup).
- • Trading Signal: Cautiously bullish, seeking pullback buying opportunities.
- • Specific Operational Suggestions:
- 1. Entry Timing: Wait for the price to pull back near the secondary support zone (0.585-0.590) and show a low-volume stabilization signal (e.g., a narrow-range candlestick with volume below average) to consider it a low-risk entry point.
- 2. Stop-Loss Placement: The initial stop-loss should be set below the primary support at 0.532 (e.g., 0.525). Aggressive traders may set it below the recent consolidation low of 0.565.
- 3. Target Levels: The first target is the near-term resistance zone 0.609-0.619. If a breakout occurs with volume (VOLUME_AVG_7D_RATIO > 1.2), the second target can be raised to the primary resistance zone 0.630-0.645.
- • Future Validation Points:
- 1. Bullish Validation: The price needs to maintain its position above the short-term moving averages (MA_5D, MA_10D) and, within the coming weeks, break out above 0.619 on high volume. This would confirm the end of accumulation and the beginning of the markup phase.
- 2. Bearish Risk: If the price breaks below 0.565 (lower boundary of the recent range) on high volume, it indicates a failed secondary test, with supply regaining dominance, potentially invalidating the bottoming structure and necessitating re-evaluation.
End of Report
Disclaimer: This report is based entirely on the provided historical data and the principles of Wyckoff volume-price analysis. All conclusions are derived from data analysis and do not constitute any investment advice. The market involves risks; investment requires caution.
Thank you for your attention! Wyckoff Volume-Price Market Analysis is released daily at 8:00 AM before the market opens. Please leave comments and share; your recognition is crucial. Let's work together to see the market signals clearly.
Member discussion: